EGY Stock Tickeron detected bearish Stock Pattern: Rectangle Top EGY on November 10, 2025, netting in a 4.85% gain over 1 week


at Tickeron.com


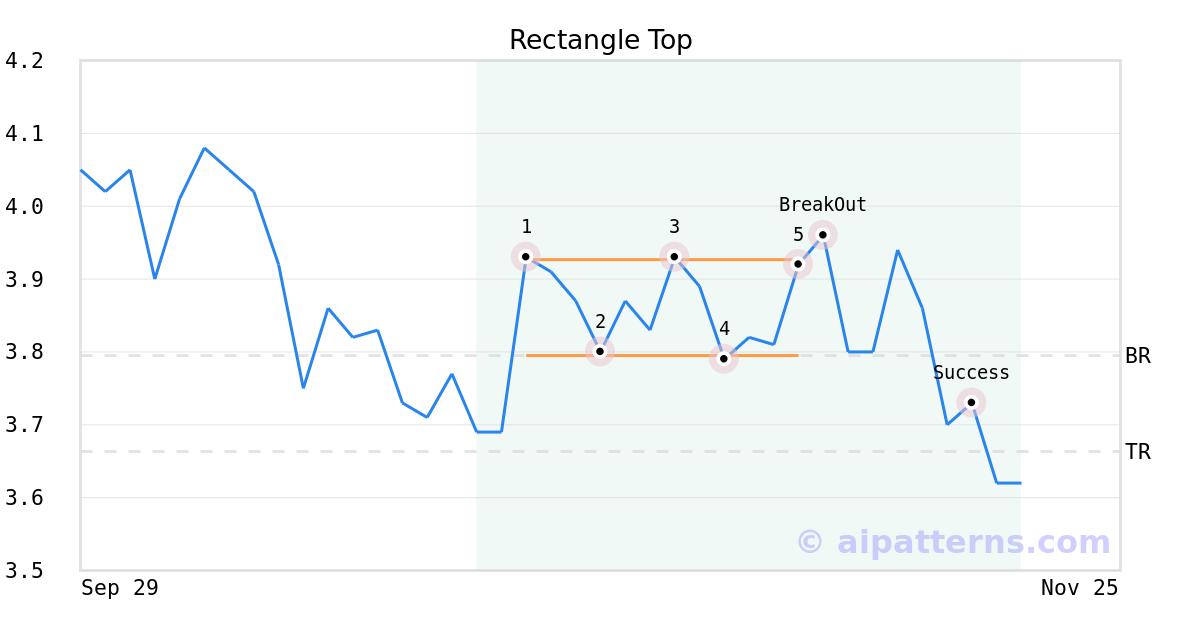
On November 07, 2025, A.I.dvisor detected a Rectangle Top Pattern (Bearish) for Vaalco Energy (EGY, $3.92). 3 days later, on November 10, 2025, A.I.dvisor confirmed the Bearish pattern, setting a target price of the stock. On November 18, 2025, the stock hit the target price of $3.66 – resulting in a gain for traders who shorted the stock on the pattern detection date.
EGY sees MACD Histogram just turned negative
EGY saw its Moving Average Convergence Divergence Histogram (MACD) turn negative on November 17, 2025. This is a bearish signal that suggests the stock could decline going forward. Tickeron's A.I.dvisor looked at 56 instances where the indicator turned negative. In of the 56 cases the stock moved lower in the days that followed. This puts the odds of a downward move at .

Technical Analysis (Indicators)
Bearish Trend Analysis
The Momentum Indicator moved below the 0 level on November 14, 2025. You may want to consider selling the stock, shorting the stock, or exploring put options on EGY as a result. In of 83 cases where the Momentum Indicator fell below 0, the stock fell further within the subsequent month. The odds of a continued downward trend are .
EGY moved below its 50-day moving average on November 11, 2025 date and that indicates a change from an upward trend to a downward trend.
Following a 3-day decline, the stock is projected to fall further. Considering past instances where EGY declined for three days, the price rose further in of 62 cases within the following month. The odds of a continued downward trend are .
The Aroon Indicator for EGY entered a downward trend on December 02, 2025. This could indicate a strong downward move is ahead for the stock. Traders may want to consider selling the stock or buying put options.
Bullish Trend Analysis
The Stochastic Oscillator suggests the stock price trend may be in a reversal from a downward trend to an upward trend. of 62 cases where EGY's Stochastic Oscillator exited the oversold zone resulted in an increase in price. Tickeron's analysis proposes that the odds of a continued upward trend are .
Following a 3-day Advance, the price is estimated to grow further. Considering data from situations where EGY advanced for three days, in of 294 cases, the price rose further within the following month. The odds of a continued upward trend are .
EGY may jump back above the lower band and head toward the middle band. Traders may consider buying the stock or exploring call options.
Fundamental Analysis (Ratings)
The Tickeron PE Growth Rating for this company is (best 1 - 100 worst), pointing to outstanding earnings growth. The PE Growth rating is based on a comparative analysis of stock PE ratio increase over the last 12 months compared against S&P 500 index constituents.
The Tickeron Valuation Rating of (best 1 - 100 worst) indicates that the company is seriously undervalued in the industry. This rating compares market capitalization estimated by our proprietary formula with the current market capitalization. This rating is based on the following metrics, as compared to industry averages: P/B Ratio (0.717) is normal, around the industry mean (11.267). P/E Ratio (12.889) is within average values for comparable stocks, (25.534). Projected Growth (PEG Ratio) (0.000) is also within normal values, averaging (4.158). Dividend Yield (0.072) settles around the average of (0.077) among similar stocks. P/S Ratio (0.928) is also within normal values, averaging (170.002).
The Tickeron Seasonality Score of (best 1 - 100 worst) indicates that the company is fair valued in the industry. The Tickeron Seasonality score describes the variance of predictable price changes around the same period every calendar year. These changes can be tied to a specific month, quarter, holiday or vacation period, as well as a meteorological or growing season.
The Tickeron Profit vs. Risk Rating rating for this company is (best 1 - 100 worst), indicating well-balanced risk and returns. The average Profit vs. Risk Rating rating for the industry is 73, placing this stock slightly better than average.
The Tickeron Price Growth Rating for this company is (best 1 - 100 worst), indicating fairly steady price growth. EGY’s price grows at a lower rate over the last 12 months as compared to S&P 500 index constituents.
The Tickeron SMR rating for this company is (best 1 - 100 worst), indicating weak sales and an unprofitable business model. SMR (Sales, Margin, Return on Equity) rating is based on comparative analysis of weighted Sales, Income Margin and Return on Equity values compared against S&P 500 index constituents. The weighted SMR value is a proprietary formula developed by Tickeron and represents an overall profitability measure for a stock.
Advertisement
General Information
a company which engages in the acquisition, exploration, development and production of crude oil and natural gas
Industry OilGasProduction