EMM Stock Tickeron detected bullish ETF Pattern: Triple Bottoms on November 13, 2025


at Tickeron.com


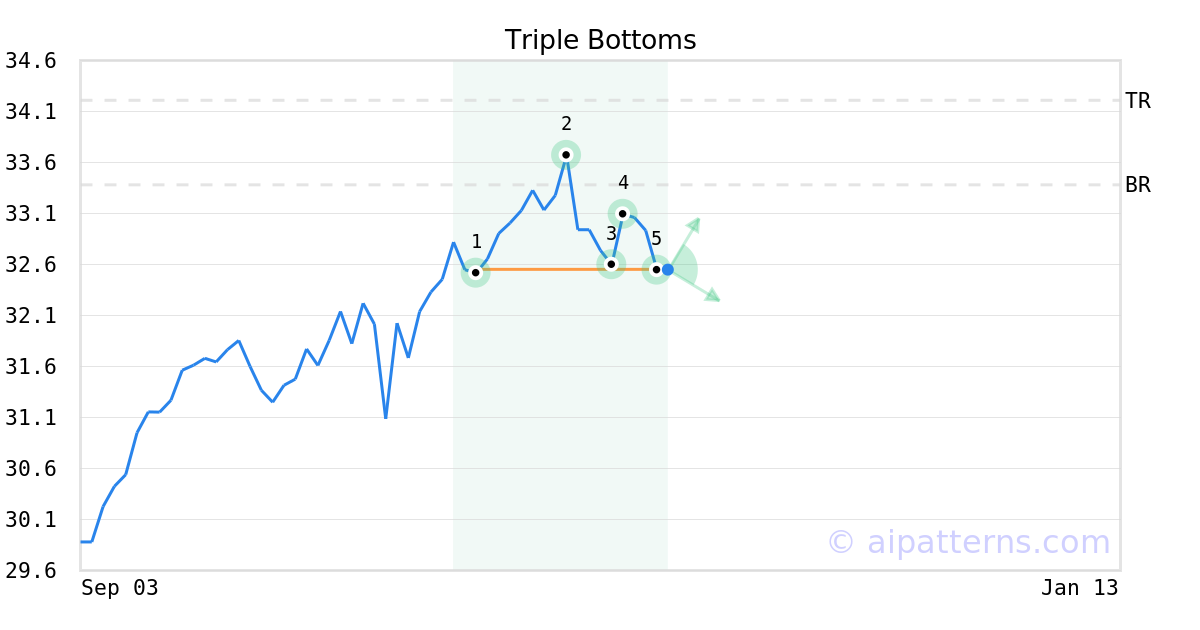
A.I.dvisor detected a bullish Triple Bottoms pattern for EMM stock. This pattern was detected on November 13, 2025 . The odds of reaching the target price are .
The Triple Bottom pattern appears when there are three distinct low points (1, 3, 5) that represent a consistent support level.
Consider buying a security or call option at the breakout price level. When trading, wait for the confirmation move, which is when the price rises above the breakout level.
Aroon Indicator for EMM shows an upward move is likely
EMM's Aroon Indicator triggered a bullish signal on November 12, 2025. Tickeron's A.I.dvisor detected that the AroonUp green line is above 70 while the AroonDown red line is below 30. When the up indicator moves above 70 and the down indicator remains below 30, it is a sign that the stock could be setting up for a bullish move. Traders may want to buy the stock or look to buy calls options. A.I.dvisor looked at 117 similar instances where the Aroon Indicator showed a similar pattern. In of the 117 cases, the stock moved higher in the days that followed. This puts the odds of a move higher at .

Technical Analysis (Indicators)
Bullish Trend Analysis
The Momentum Indicator moved above the 0 level on November 28, 2025. You may want to consider a long position or call options on EMM as a result. In of 52 past instances where the momentum indicator moved above 0, the stock continued to climb. The odds of a continued upward trend are .
EMM moved above its 50-day moving average on November 25, 2025 date and that indicates a change from a downward trend to an upward trend.
Following a 3-day Advance, the price is estimated to grow further. Considering data from situations where EMM advanced for three days, in of 174 cases, the price rose further within the following month. The odds of a continued upward trend are .
Bearish Trend Analysis
The 10-day RSI Indicator for EMM moved out of overbought territory on November 04, 2025. This could be a bearish sign for the stock. Traders may want to consider selling the stock or buying put options. Tickeron's A.I.dvisor looked at 18 similar instances where the indicator moved out of overbought territory. In of the 18 cases, the stock moved lower in the following days. This puts the odds of a move lower at .
The Stochastic Oscillator entered the overbought zone. Expect a price pull-back in the foreseeable future.
The Moving Average Convergence Divergence Histogram (MACD) for EMM turned negative on November 05, 2025. This could be a sign that the stock is set to turn lower in the coming weeks. Traders may want to sell the stock or buy put options. Tickeron's A.I.dvisor looked at 27 similar instances when the indicator turned negative. In of the 27 cases the stock turned lower in the days that followed. This puts the odds of success at .
Following a 3-day decline, the stock is projected to fall further. Considering past instances where EMM declined for three days, the price rose further in of 62 cases within the following month. The odds of a continued downward trend are .
Advertisement
General Information
Category DiversifiedEmergingMkts