ETC.X Crypto Tickeron detected bearish Crypto Pattern: Three Falling Peaks ETC.X on November 02, 2025, netting in a 17.41% gain over 2 weeks


at Tickeron.com


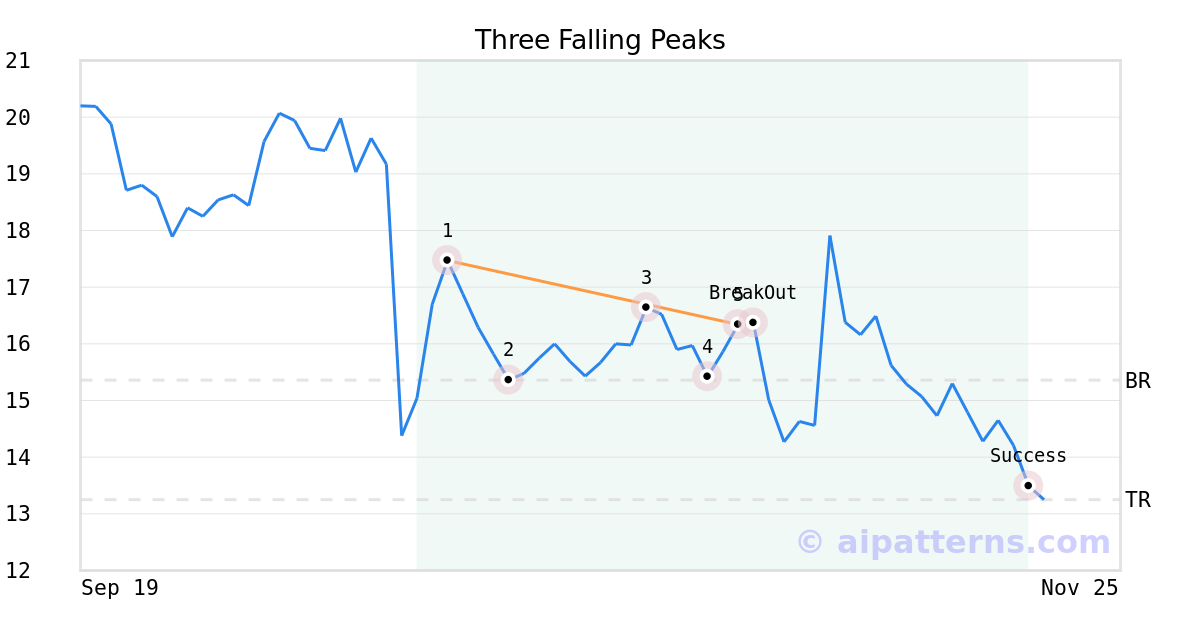
On November 01, 2025, A.I.dvisor detected a Three Falling Peaks Pattern (Bearish) for Ethereum Classic cryptocurrency (ETC.X, $16.325280). 1 day later, on November 02, 2025, A.I.dvisor confirmed the Bearish pattern, setting a target price of the stock. On November 20, 2025, the stock hit the target price of $13.250000 – resulting in a +1 gain for traders who shorted the stock on the pattern detection date.
ETC.X's Indicator enters downward trend
The Aroon Indicator for ETC.X entered a downward trend on November 28, 2025. Tickeron's A.I.dvisor identified a pattern where the AroonDown red line was above 70 while the AroonUp green line was below 30 for three straight days. This could indicate a strong downward move is ahead for the stock. Traders may want to consider selling the stock or buying put options. A.I.dvisor looked at 234 similar instances where the Aroon Indicator formed such a pattern. In of the 234 cases the stock moved lower. This puts the odds of a downward move at .

Technical Analysis (Indicators)
Bearish Trend Analysis
ETC.X moved below its 50-day moving average on November 08, 2025 date and that indicates a change from an upward trend to a downward trend.
Following a 3-day decline, the stock is projected to fall further. Considering past instances where ETC.X declined for three days, the price rose further in of 62 cases within the following month. The odds of a continued downward trend are .
ETC.X broke above its upper Bollinger Band on November 07, 2025. This could be a sign that the stock is set to drop as the stock moves back below the upper band and toward the middle band. You may want to consider selling the stock or exploring put options.
Bullish Trend Analysis
The Stochastic Oscillator suggests the stock price trend may be in a reversal from a downward trend to an upward trend. of 93 cases where ETC.X's Stochastic Oscillator exited the oversold zone resulted in an increase in price. Tickeron's analysis proposes that the odds of a continued upward trend are .
The Momentum Indicator moved above the 0 level on November 30, 2025. You may want to consider a long position or call options on ETC.X as a result. In of 129 past instances where the momentum indicator moved above 0, the stock continued to climb. The odds of a continued upward trend are .
The Moving Average Convergence Divergence (MACD) for ETC.X just turned positive on November 26, 2025. Looking at past instances where ETC.X's MACD turned positive, the stock continued to rise in of 67 cases over the following month. The odds of a continued upward trend are .
Following a 3-day Advance, the price is estimated to grow further. Considering data from situations where ETC.X advanced for three days, in of 427 cases, the price rose further within the following month. The odds of a continued upward trend are .