EVX Stock Tickeron detected bullish ETF Pattern: Broadening Wedge Ascending EVX on November 19, 2025, netting in a 2.26% gain over 6 days


at Tickeron.com


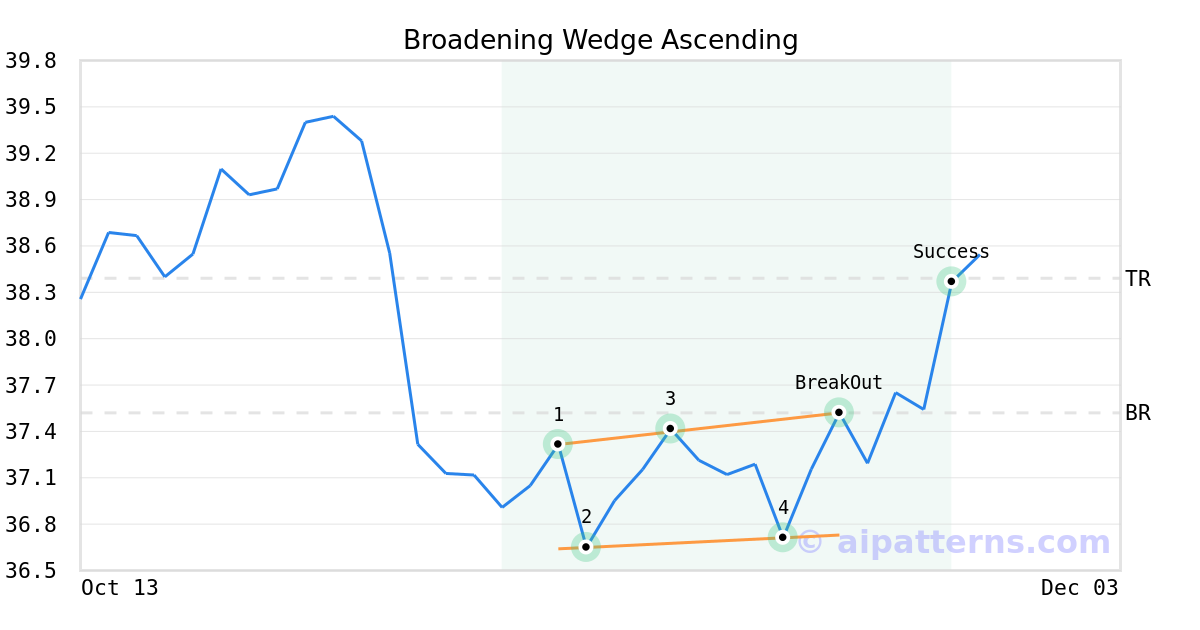
On November 19, 2025, A.I.dvisor detected a Broadening Wedge Ascending Pattern (Bullish) for VanEck Environmental Svcs ETF (EVX, $37.52). On November 19, 2025, A.I.dvisor confirmed the Bullish pattern, setting a target price of $38.39. 6 days later, on November 25, 2025, EVX reached the target price resulting in a for traders who took a long position in the stock.
EVX's RSI Indicator ascends from oversold territory
The RSI Oscillator for EVX moved out of oversold territory on November 07, 2025. This could be a sign that the stock is shifting from a downward trend to an upward trend. Traders may want to buy the stock or call options. The A.I.dvisor looked at 17 similar instances when the indicator left oversold territory. In of the 17 cases the stock moved higher. This puts the odds of a move higher at .

Technical Analysis (Indicators)
Bullish Trend Analysis
The Momentum Indicator moved above the 0 level on November 18, 2025. You may want to consider a long position or call options on EVX as a result. In of 79 past instances where the momentum indicator moved above 0, the stock continued to climb. The odds of a continued upward trend are .
The Moving Average Convergence Divergence (MACD) for EVX just turned positive on November 18, 2025. Looking at past instances where EVX's MACD turned positive, the stock continued to rise in of 47 cases over the following month. The odds of a continued upward trend are .
EVX moved above its 50-day moving average on November 25, 2025 date and that indicates a change from a downward trend to an upward trend.
Following a 3-day Advance, the price is estimated to grow further. Considering data from situations where EVX advanced for three days, in of 351 cases, the price rose further within the following month. The odds of a continued upward trend are .
Bearish Trend Analysis
The Stochastic Oscillator has been in the overbought zone for 2 days. Expect a price pull-back in the near future.
Following a 3-day decline, the stock is projected to fall further. Considering past instances where EVX declined for three days, the price rose further in of 62 cases within the following month. The odds of a continued downward trend are .
EVX broke above its upper Bollinger Band on November 25, 2025. This could be a sign that the stock is set to drop as the stock moves back below the upper band and toward the middle band. You may want to consider selling the stock or exploring put options.
Advertisement
General Information
Category Industrials