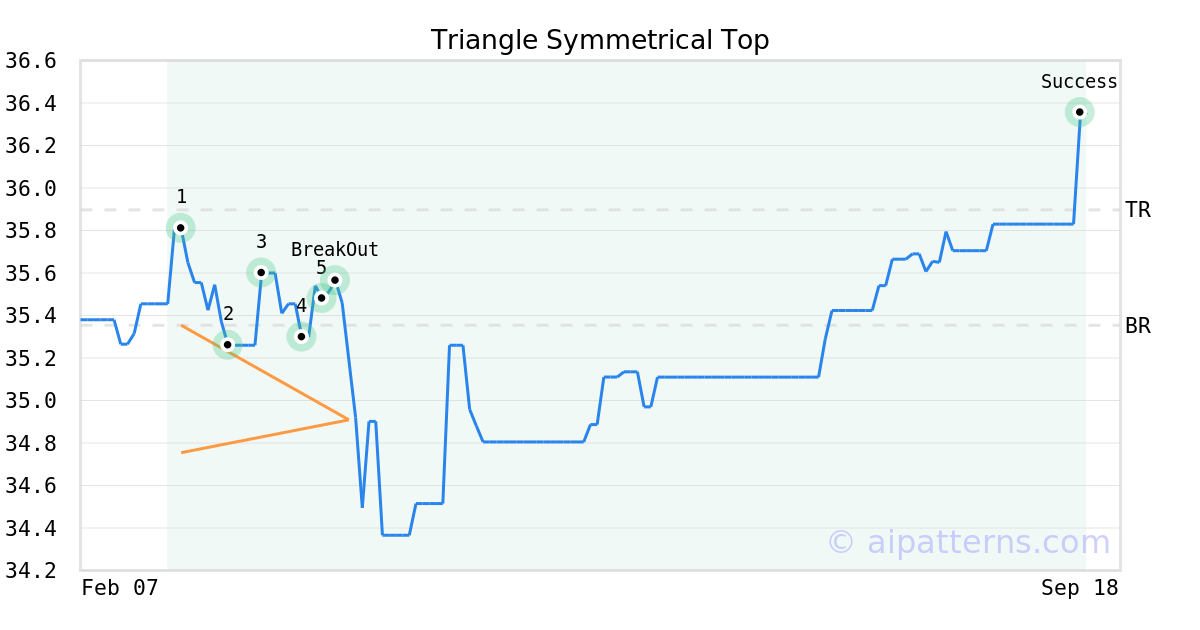
EYEG Stock Tickeron detected bullish ETF Pattern: Triangle Symmetrical Top EYEG on April 03, 2025, netting in a 4.62% gain over 5 months


at Tickeron.com


Aroon Indicator for EYEG shows an upward move is likely
EYEG's Aroon Indicator triggered a bullish signal on September 26, 2025. Tickeron's A.I.dvisor detected that the AroonUp green line is above 70 while the AroonDown red line is below 30. When the up indicator moves above 70 and the down indicator remains below 30, it is a sign that the stock could be setting up for a bullish move. Traders may want to buy the stock or look to buy calls options. A.I.dvisor looked at 137 similar instances where the Aroon Indicator showed a similar pattern. In of the 137 cases, the stock moved higher in the days that followed. This puts the odds of a move higher at .

Technical Analysis (Indicators)
Bullish Trend Analysis
Bearish Trend Analysis
The Stochastic Oscillator may be shifting from an upward trend to a downward trend. In of 30 cases where EYEG's Stochastic Oscillator exited the overbought zone, the price fell further within the following month. The odds of a continued downward trend are .
The Moving Average Convergence Divergence Histogram (MACD) for EYEG turned negative on September 26, 2025. This could be a sign that the stock is set to turn lower in the coming weeks. Traders may want to sell the stock or buy put options. Tickeron's A.I.dvisor looked at 23 similar instances when the indicator turned negative. In of the 23 cases the stock turned lower in the days that followed. This puts the odds of success at .
EYEG broke above its upper Bollinger Band on September 11, 2025. This could be a sign that the stock is set to drop as the stock moves back below the upper band and toward the middle band. You may want to consider selling the stock or exploring put options.


Advertisement
General Information
Category IntermediateTermBond