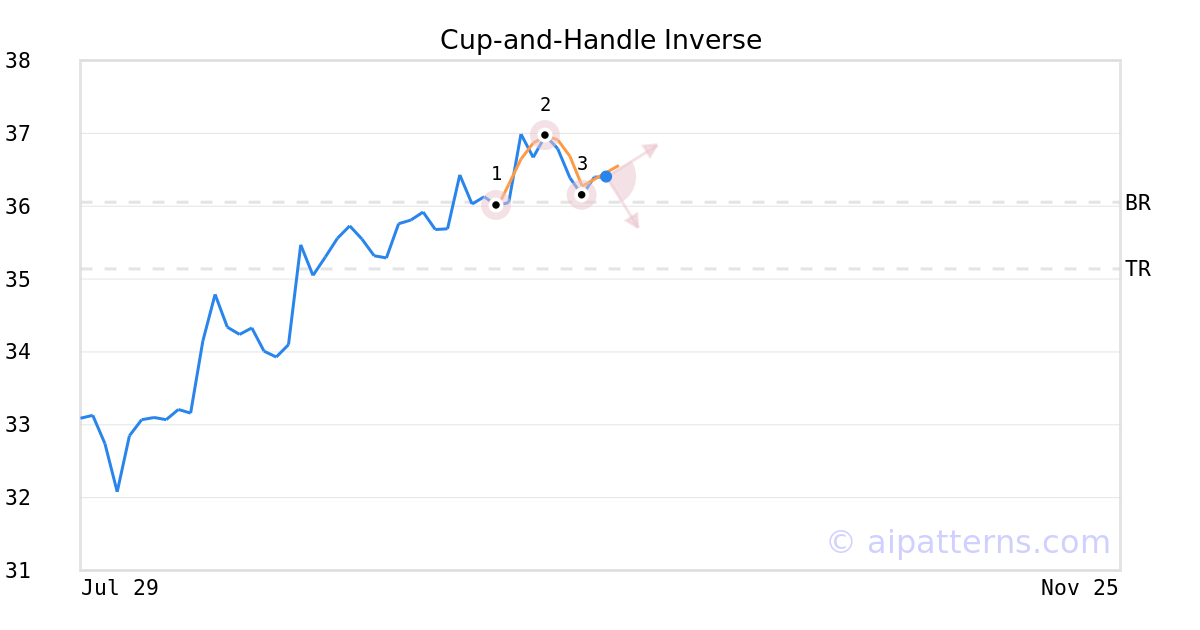
FESM Stock Tickeron detected bearish ETF Pattern: Cup-and-Handle Inverse on September 30, 2025


at Tickeron.com


FESM sees MACD Histogram crosses below signal line
FESM saw its Moving Average Convergence Divergence Histogram (MACD) turn negative on September 24, 2025. This is a bearish signal that suggests the stock could decline going forward. Tickeron's A.I.dvisor looked at 16 instances where the indicator turned negative. In of the 16 cases the stock moved lower in the days that followed. This puts the odds of a downward move at .

Technical Analysis (Indicators)
Bearish Trend Analysis
The 10-day RSI Indicator for FESM moved out of overbought territory on September 23, 2025. This could be a bearish sign for the stock. Traders may want to consider selling the stock or buying put options. Tickeron's A.I.dvisor looked at 15 similar instances where the indicator moved out of overbought territory. In of the 15 cases, the stock moved lower in the following days. This puts the odds of a move lower at .
The Stochastic Oscillator may be shifting from an upward trend to a downward trend. In of 26 cases where FESM's Stochastic Oscillator exited the overbought zone, the price fell further within the following month. The odds of a continued downward trend are .
Following a 3-day decline, the stock is projected to fall further. Considering past instances where FESM declined for three days, the price rose further in of 62 cases within the following month. The odds of a continued downward trend are .
Bullish Trend Analysis
The Momentum Indicator moved above the 0 level on October 20, 2025. You may want to consider a long position or call options on FESM as a result. In of 33 past instances where the momentum indicator moved above 0, the stock continued to climb. The odds of a continued upward trend are .
Following a 3-day Advance, the price is estimated to grow further. Considering data from situations where FESM advanced for three days, in of 122 cases, the price rose further within the following month. The odds of a continued upward trend are .
FESM may jump back above the lower band and head toward the middle band. Traders may consider buying the stock or exploring call options.
The Aroon Indicator entered an Uptrend today. In of 99 cases where FESM Aroon's Indicator entered an Uptrend, the price rose further within the following month. The odds of a continued Uptrend are .


Advertisement
General Information
Category SmallBlend