FGFH Stock Foresight Financial Group (FGFH) is expected to pay dividends on November 19, 2025


at Tickeron.com
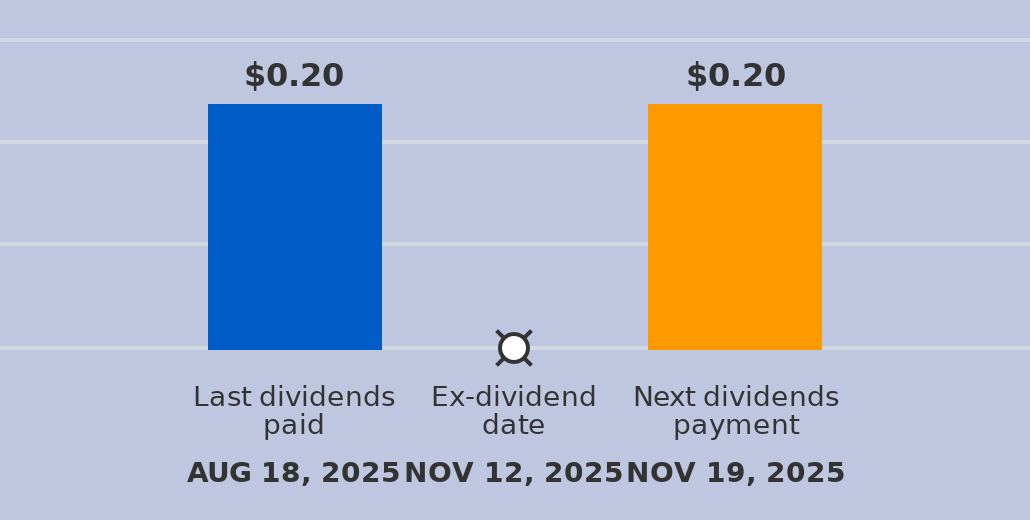
A dividend of $0.2 per share will be paid with a record date of November 19, 2025, and an ex-dividend date of November 12, 2025. The last dividend of $0.2 was paid on August 18, 2025. The ex-dividend date is usually set several business days before the record date. If a stock is purchased on its ex-dividend date or after, the next dividend payment will not be received. Instead, the dividends are repossessed by to the seller. If the stocks are purchased before the ex-dividend date, the buyer will receive the dividends.
FGFH in +0.98% Uptrend, rising for three consecutive days on November 28, 2025
Moving higher for three straight days is viewed as a bullish sign. Keep an eye on this stock for future growth. Considering data from situations where FGFH advanced for three days, in of 67 cases, the price rose further within the following month. The odds of a continued upward trend are .

Technical Analysis (Indicators)
Bullish Trend Analysis
The Aroon Indicator entered an Uptrend today. In of 241 cases where FGFH Aroon's Indicator entered an Uptrend, the price rose further within the following month. The odds of a continued Uptrend are .
Bearish Trend Analysis
The Moving Average Convergence Divergence Histogram (MACD) for FGFH turned negative on November 21, 2025. This could be a sign that the stock is set to turn lower in the coming weeks. Traders may want to sell the stock or buy put options. Tickeron's A.I.dvisor looked at 37 similar instances when the indicator turned negative. In of the 37 cases the stock turned lower in the days that followed. This puts the odds of success at .
FGFH broke above its upper Bollinger Band on November 04, 2025. This could be a sign that the stock is set to drop as the stock moves back below the upper band and toward the middle band. You may want to consider selling the stock or exploring put options.
Fundamental Analysis (Ratings)
The Tickeron PE Growth Rating for this company is (best 1 - 100 worst), pointing to outstanding earnings growth. The PE Growth rating is based on a comparative analysis of stock PE ratio increase over the last 12 months compared against S&P 500 index constituents.
The Tickeron Profit vs. Risk Rating rating for this company is (best 1 - 100 worst), indicating low risk on high returns. The average Profit vs. Risk Rating rating for the industry is 51, placing this stock better than average.
The Tickeron Valuation Rating of (best 1 - 100 worst) indicates that the company is fair valued in the industry. This rating compares market capitalization estimated by our proprietary formula with the current market capitalization. This rating is based on the following metrics, as compared to industry averages: P/B Ratio (0.884) is normal, around the industry mean (1.123). P/E Ratio (8.524) is within average values for comparable stocks, (18.233). Projected Growth (PEG Ratio) (0.000) is also within normal values, averaging (3.226). Dividend Yield (0.020) settles around the average of (0.036) among similar stocks. P/S Ratio (2.589) is also within normal values, averaging (5.219).
The Tickeron Price Growth Rating for this company is (best 1 - 100 worst), indicating steady price growth. FGFH’s price grows at a higher rate over the last 12 months as compared to S&P 500 index constituents.
The Tickeron Seasonality Score of (best 1 - 100 worst) indicates that the company is fair valued in the industry. The Tickeron Seasonality score describes the variance of predictable price changes around the same period every calendar year. These changes can be tied to a specific month, quarter, holiday or vacation period, as well as a meteorological or growing season.
The Tickeron SMR rating for this company is (best 1 - 100 worst), indicating slightly weaker than average sales and a marginally profitable business model. SMR (Sales, Margin, Return on Equity) rating is based on comparative analysis of weighted Sales, Income Margin and Return on Equity values compared against S&P 500 index constituents. The weighted SMR value is a proprietary formula developed by Tickeron and represents an overall profitability measure for a stock.
Advertisement
General Information
Industry RegionalBanks