MENU

FMOO Stock F&M Ban (FMOO) is expected to pay dividends on September 30, 2025

A.I.dvisor
at Tickeron.com
Loading...
Tickeron 
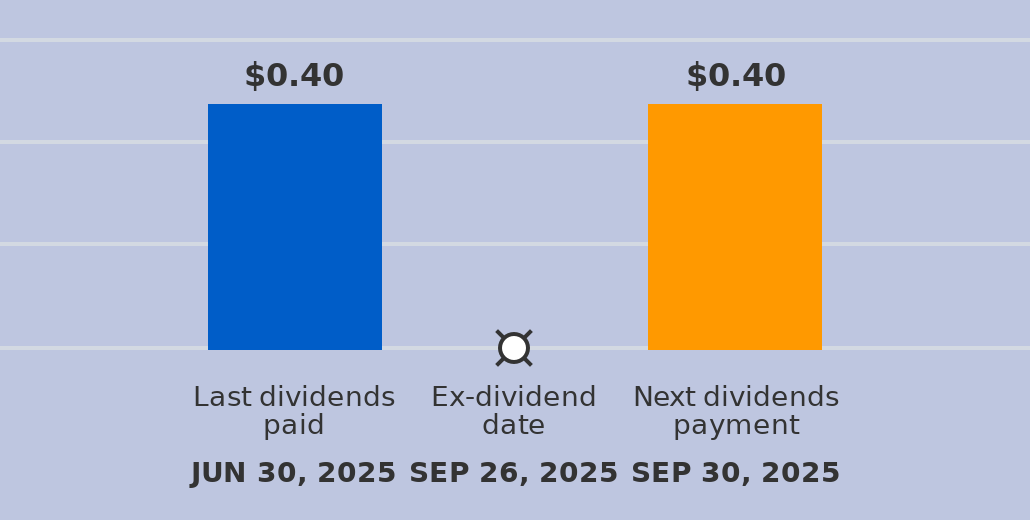
A dividend of $0.4 per share will be paid with a record date of September 30, 2025, and an ex-dividend date of September 26, 2025. The last dividend of $0.4 was paid on June 30, 2025. The ex-dividend date is usually set several business days before the record date. If a stock is purchased on its ex-dividend date or after, the next dividend payment will not be received. Instead, the dividends are repossessed by to the seller. If the stocks are purchased before the ex-dividend date, the buyer will receive the dividends.

FMOO's RSI Indicator soaring into overbought territory

The RSI Indicator for FMOO moved into overbought territory on September 26, 2025. Be on the watch for a price drop or consolidation in the future -- when this happens, think about selling the stock or exploring put options.

Price Prediction Chart

Technical Analysis (Indicators)

Bearish Trend Analysis
Bullish Trend Analysis

The Stochastic Oscillator suggests the stock price trend may be in a reversal from a downward trend to an upward trend. of 14 cases where FMOO's Stochastic Oscillator exited the oversold zone resulted in an increase in price. Tickeron's analysis proposes that the odds of a continued upward trend are .

Fundamental Analysis (Ratings)

The Tickeron Valuation Rating of (best 1 - 100 worst) indicates that the company is seriously undervalued in the industry. This rating compares market capitalization estimated by our proprietary formula with the current market capitalization. This rating is based on the following metrics, as compared to industry averages: FMOO's P/B Ratio (0.000) is slightly lower than the industry average of (1.125). P/E Ratio (0.000) is within average values for comparable stocks, (20.601). Projected Growth (PEG Ratio) (0.000) is also within normal values, averaging (3.828). Dividend Yield (0.024) settles around the average of (0.037) among similar stocks. P/S Ratio (0.000) is also within normal values, averaging (5.144).

The Tickeron Price Growth Rating for this company is (best 1 - 100 worst), indicating fairly steady price growth. FMOO’s price grows at a lower rate over the last 12 months as compared to S&P 500 index constituents.

The Tickeron PE Growth Rating for this company is (best 1 - 100 worst), pointing to worse than average earnings growth. The PE Growth rating is based on a comparative analysis of stock PE ratio increase over the last 12 months compared against S&P 500 index constituents.

The Tickeron SMR rating for this company is (best 1 - 100 worst), indicating weak sales and an unprofitable business model. SMR (Sales, Margin, Return on Equity) rating is based on comparative analysis of weighted Sales, Income Margin and Return on Equity values compared against S&P 500 index constituents. The weighted SMR value is a proprietary formula developed by Tickeron and represents an overall profitability measure for a stock.

The Tickeron Profit vs. Risk Rating rating for this company is (best 1 - 100 worst), indicating that the returns do not compensate for the risks. FMOO’s unstable profits reported over time resulted in significant Drawdowns within these last five years. A stable profit reduces stock drawdown and volatility. The average Profit vs. Risk Rating rating for the industry is 52, placing this stock worse than average.

View a ticker or compare two or three
FMOO
Daily Signalchanged days ago
Gain/Loss if bought
Show more...
Interact to see
Advertisement
A.I.Advisor
published price charts
These past five trading days, the stock lost 0.00% with an average daily volume of 0 shares traded.The stock tracked a drawdown of 0% for this period.
A.I. Advisor
published General Information

General Information

Industry RegionalBanks

Profile
Fundamentals
Details
Industry
N/A
Address
41 South First Street
Phone
+1 937 866-2455
Employees
155
Web
https://www.bankwithfm.com