MENU
FSSRX
AS OF
Nov 19 closing price
Price
$20.82
Change
+$0.13 (+0.63%)
Net Assets
2.37B
Intraday BUY SELL Signals
FSSRX Stock Tickeron detected bullish Mutual Fund Pattern: Triangle Symmetrical Bottom on June 03, 2024


A.I.dvisor
at Tickeron.com
at Tickeron.com
Buy or Sell
View Daily SignalsLoading...
Triangle Symmetrical Bottom
FSSRX - Franklin Small Cap Growth R


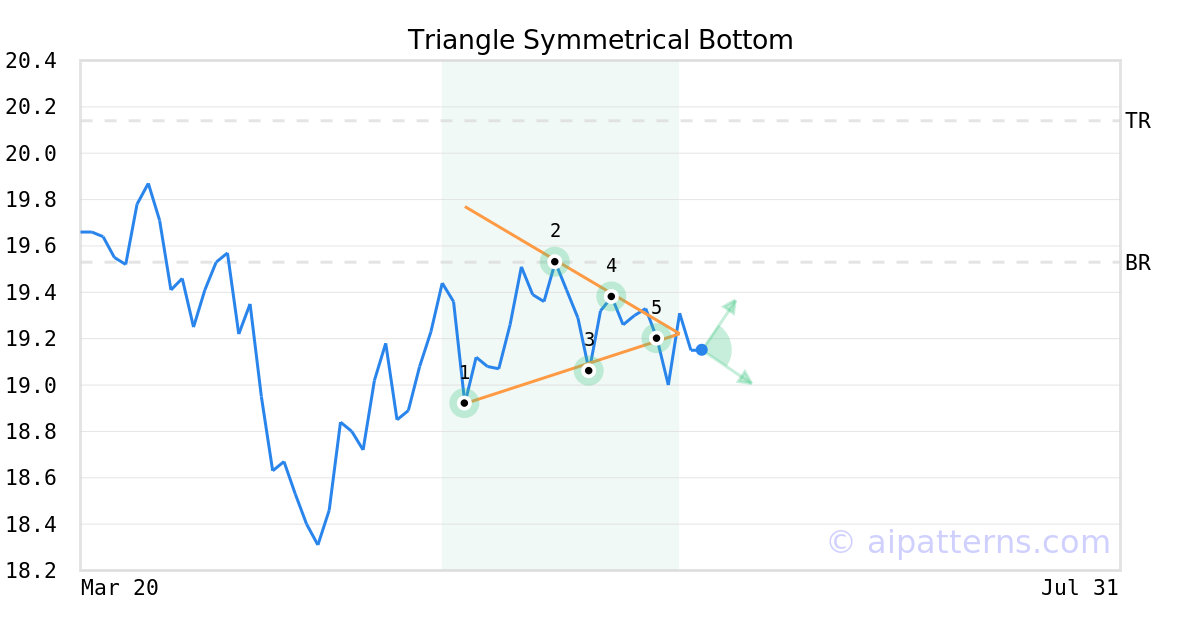
Emerged: 06/03/24
Breakout: $19.53
Price: $19.31
Target price: $20.14
A.I.dvisor detected a bullish Triangle Symmetrical Bottom pattern for FSSRX stock. This pattern was detected on June 03, 2024 . The odds of reaching the target price are 6.
The Symmetrical Triangle Bottom pattern forms when the price of a security fails to retest a high or a low and ultimately forms two narrowing trend lines. As the support and resistance levels consolidate, they form a triangle.
Consider buying a security or call option at the breakout price level. When trading, wait for the confirmation move, which is when the price rises above the breakout level.
View a ticker or compare two or three
VS
VS
Interact to see
Advertisement
Advertisement
A.I.Advisor
published price charts
These past five trading days, the mutual fund lost 0.00%.
A.I. Advisor
published General Information
General Information
Category SmallGrowth
Profile
Fundamentals
Details
Category
Small Growth
Address
Franklin Strategic SeriesOne Franklin ParkwaySan Mateo
Phone
N/A
Web
www.franklintempleton.com