GAM Stock Tickeron detected bearish ETF Pattern: Triple Tops GAM on November 17, 2025, netting in a 0.81% gain over 6 days


at Tickeron.com


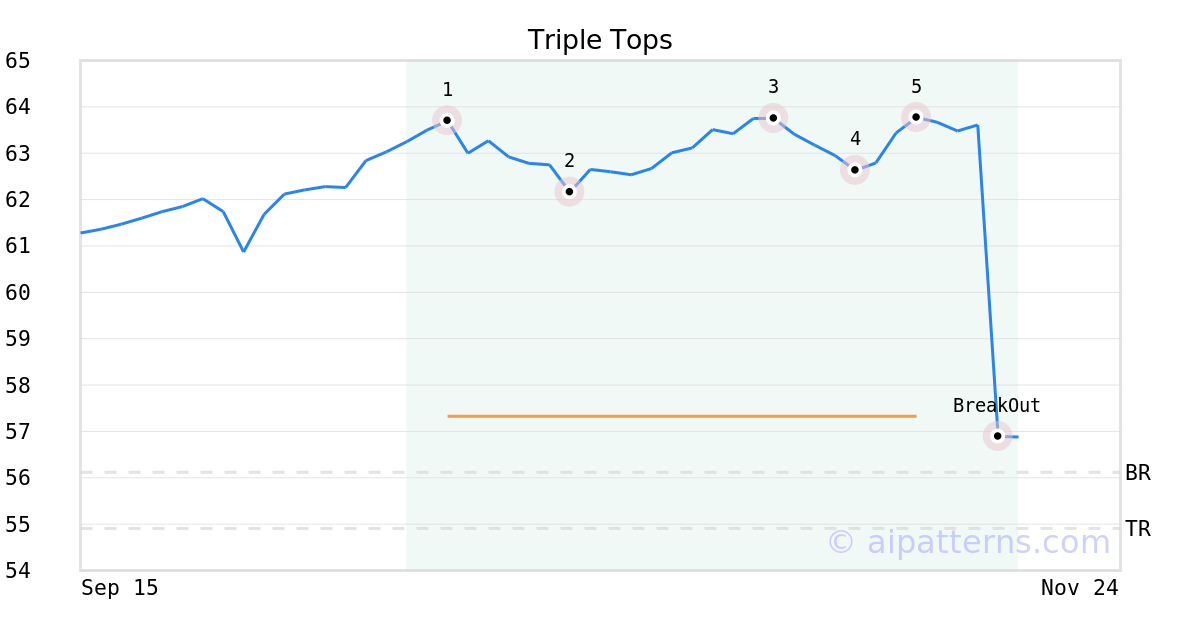
On November 11, 2025, A.I.dvisor detected a Triple Tops Pattern (Bearish) for General American Investors Company (GAM, $57.35). 6 days later, on November 17, 2025, A.I.dvisor confirmed the Bearish pattern, setting a target price of the stock. On November 17, 2025, the stock hit the target price of $54.91 – resulting in a gain for traders who shorted the stock on the pattern detection date.
GAM sees MACD Histogram crosses below signal line
GAM saw its Moving Average Convergence Divergence Histogram (MACD) turn negative on November 03, 2025. This is a bearish signal that suggests the stock could decline going forward. Tickeron's A.I.dvisor looked at 45 instances where the indicator turned negative. In of the 45 cases the stock moved lower in the days that followed. This puts the odds of a downward move at .

Technical Analysis (Indicators)
Bearish Trend Analysis
The Stochastic Oscillator may be shifting from an upward trend to a downward trend. In of 68 cases where GAM's Stochastic Oscillator exited the overbought zone, the price fell further within the following month. The odds of a continued downward trend are .
The Momentum Indicator moved below the 0 level on November 13, 2025. You may want to consider selling the stock, shorting the stock, or exploring put options on GAM as a result. In of 76 cases where the Momentum Indicator fell below 0, the stock fell further within the subsequent month. The odds of a continued downward trend are .
Following a 3-day decline, the stock is projected to fall further. Considering past instances where GAM declined for three days, the price rose further in of 62 cases within the following month. The odds of a continued downward trend are .
Bullish Trend Analysis
Following a 3-day Advance, the price is estimated to grow further. Considering data from situations where GAM advanced for three days, in of 386 cases, the price rose further within the following month. The odds of a continued upward trend are .
The Aroon Indicator entered an Uptrend today. In of 405 cases where GAM Aroon's Indicator entered an Uptrend, the price rose further within the following month. The odds of a continued Uptrend are .
Advertisement
General Information
Category Unknown