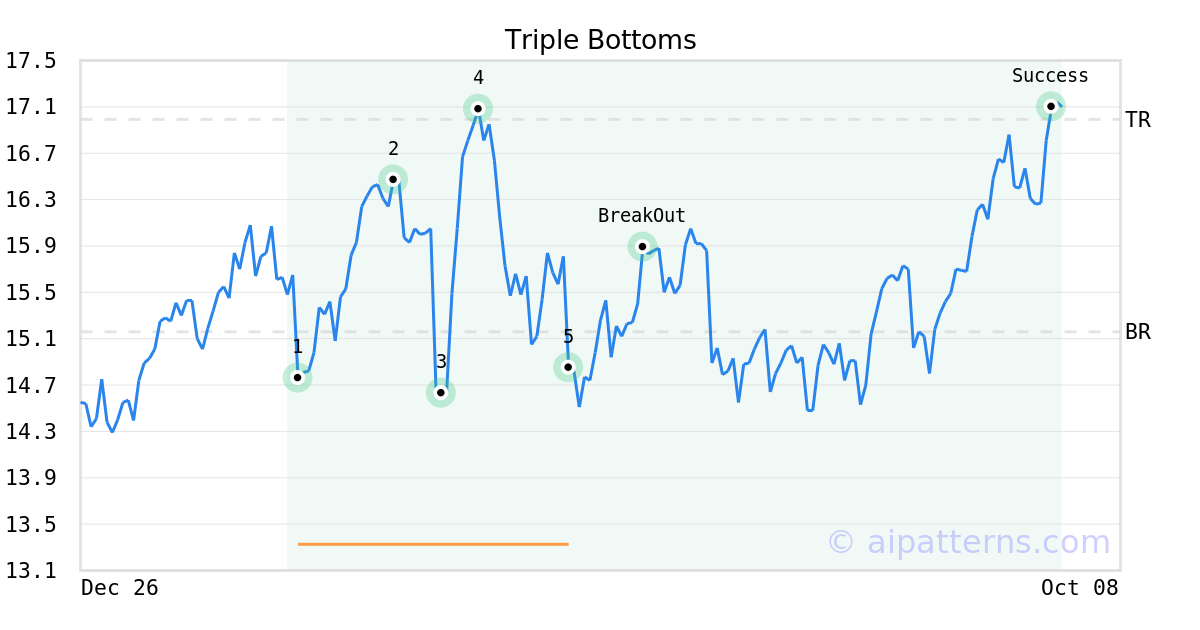
GDXY Stock Tickeron detected bullish ETF Pattern: Triple Bottoms GDXY on June 02, 2025, netting in a 37.94% gain over 4 months


at Tickeron.com


GDXY in +0.51% Uptrend, advancing for three consecutive days on October 03, 2025
Moving higher for three straight days is viewed as a bullish sign. Keep an eye on this stock for future growth. Considering data from situations where GDXY advanced for three days, in of 104 cases, the price rose further within the following month. The odds of a continued upward trend are .

Technical Analysis (Indicators)
Bullish Trend Analysis
The Aroon Indicator entered an Uptrend today. In of 70 cases where GDXY Aroon's Indicator entered an Uptrend, the price rose further within the following month. The odds of a continued Uptrend are .
Bearish Trend Analysis
The RSI Indicator demonstrates that the ticker has stayed in the overbought zone for 6 days. The longer the ticker stays in the overbought zone, the sooner a price pull-back is expected.
The Stochastic Oscillator demonstrated that the ticker has stayed in the overbought zone for 10 days. The longer the ticker stays in the overbought zone, the sooner a price pull-back is expected.
Following a 3-day decline, the stock is projected to fall further. Considering past instances where GDXY declined for three days, the price rose further in of 62 cases within the following month. The odds of a continued downward trend are .
GDXY broke above its upper Bollinger Band on September 22, 2025. This could be a sign that the stock is set to drop as the stock moves back below the upper band and toward the middle band. You may want to consider selling the stock or exploring put options.


Advertisement