GJO Stock Tickeron detected bearish ETF Pattern: Triangle Symmetrical Bottom on October 31, 2025


at Tickeron.com


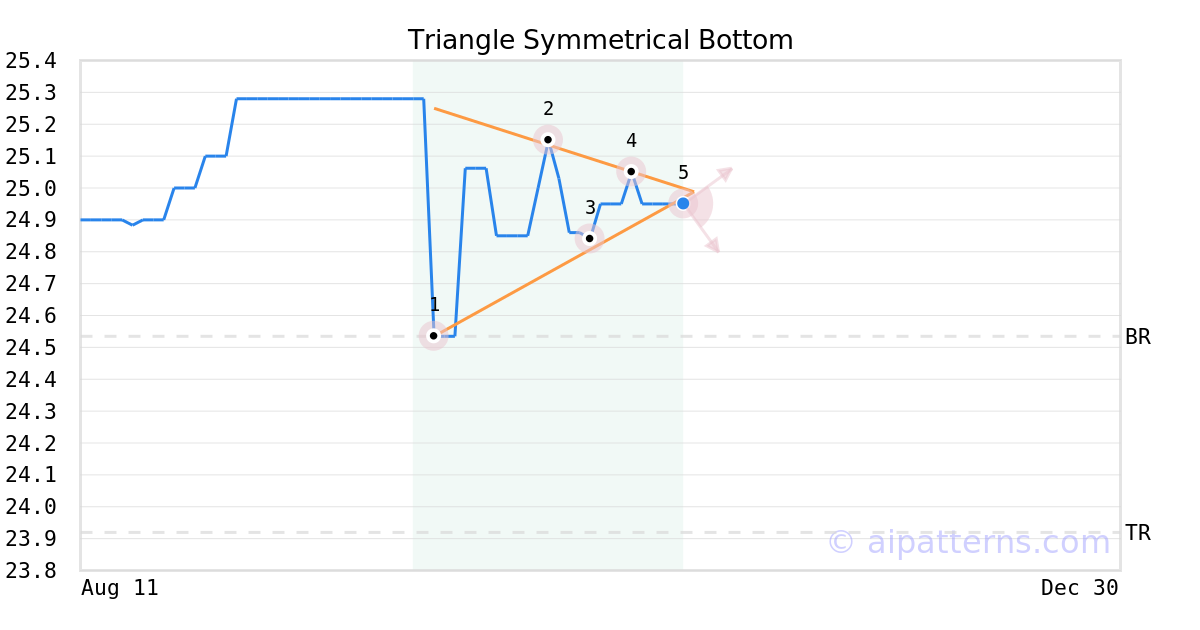
A.I.dvisor detected a bearish Triangle Symmetrical Bottom pattern for GJO stock. This pattern was detected on October 31, 2025 . The odds of reaching the target price are 6.
The Symmetrical Triangle Bottom pattern forms when the price of a security fails to retest a high or a low and ultimately forms two narrowing trend lines. Points (1, 5) form the triangle patterns.
Consider selling the security short or buying a put option at the downward breakout price level. When trading, wait for the confirmation move, which is when the price falls below the breakout level.
Momentum Indicator for GJO turns negative, indicating new downward trend
GJO saw its Momentum Indicator move below the 0 level on November 04, 2025. This is an indication that the stock could be shifting in to a new downward move. Traders may want to consider selling the stock or exploring put options. Tickeron's A.I.dvisor looked at 134 similar instances where the indicator turned negative. In of the 134 cases, the stock moved further down in the following days. The odds of a decline are at .

Technical Analysis (Indicators)
Bearish Trend Analysis
The Stochastic Oscillator may be shifting from an upward trend to a downward trend. In of 75 cases where GJO's Stochastic Oscillator exited the overbought zone, the price fell further within the following month. The odds of a continued downward trend are .
The Moving Average Convergence Divergence Histogram (MACD) for GJO turned negative on November 06, 2025. This could be a sign that the stock is set to turn lower in the coming weeks. Traders may want to sell the stock or buy put options. Tickeron's A.I.dvisor looked at 78 similar instances when the indicator turned negative. In of the 78 cases the stock turned lower in the days that followed. This puts the odds of success at .
GJO moved below its 50-day moving average on October 15, 2025 date and that indicates a change from an upward trend to a downward trend.
Following a 3-day decline, the stock is projected to fall further. Considering past instances where GJO declined for three days, the price rose further in of 62 cases within the following month. The odds of a continued downward trend are .
Bullish Trend Analysis
The RSI Oscillator points to a transition from a downward trend to an upward trend -- in cases where GJO's RSI Indicator exited the oversold zone, of 18 resulted in an increase in price. Tickeron's analysis proposes that the odds of a continued upward trend are .
GJO may jump back above the lower band and head toward the middle band. Traders may consider buying the stock or exploring call options.
Advertisement