GLM.X Crypto Tickeron detected bearish Crypto Pattern: Broadening Top on November 06, 2025


at Tickeron.com


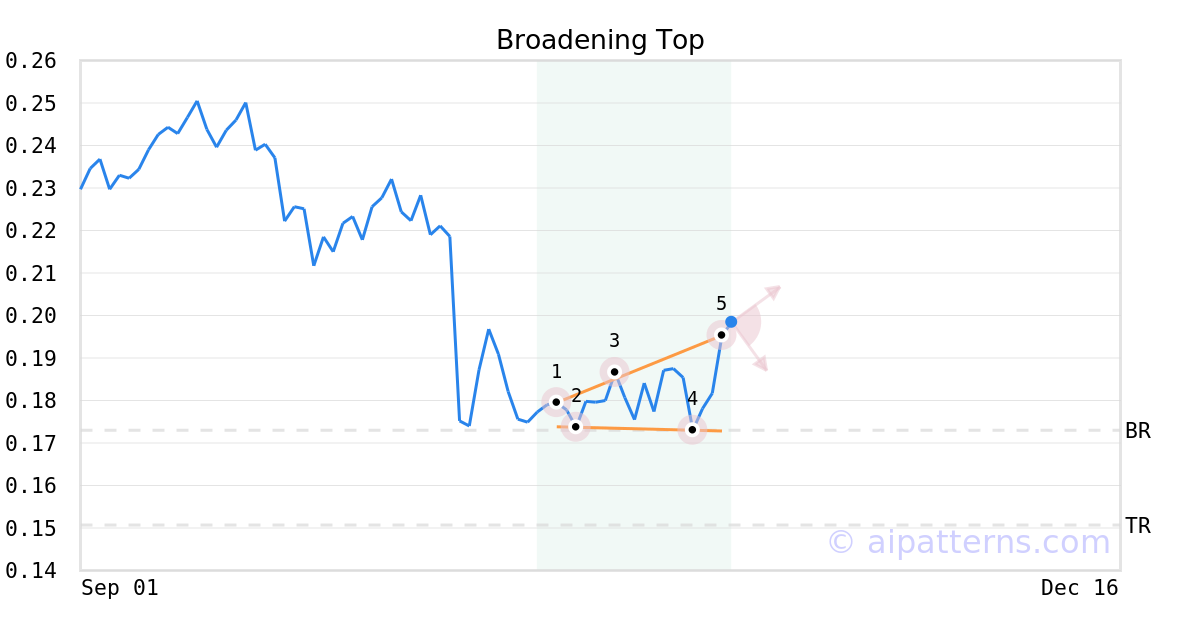
A.I.dvisor detected a bearish Broadening Top pattern for GLM.X stock. This pattern was detected on November 06, 2025 . The odds of reaching the target price are .
The Broadening Top pattern forms when a security price makes higher highs (1, 3, 5) and lower lows (2, 4) following two widening trend lines.
Consider selling the security short or buying a put option at the downward breakout price level. When trading, wait for the confirmation move, which is when the price falls below the breakout level.
GLM.X sees MACD Histogram just turned negative
GLM.X saw its Moving Average Convergence Divergence Histogram (MACD) turn negative on November 20, 2025. This is a bearish signal that suggests the stock could decline going forward. Tickeron's A.I.dvisor looked at 32 instances where the indicator turned negative. In of the 32 cases the stock moved lower in the days that followed. This puts the odds of a downward move at .

Technical Analysis (Indicators)
Bearish Trend Analysis
The 10-day RSI Indicator for GLM.X moved out of overbought territory on November 11, 2025. This could be a bearish sign for the stock. Traders may want to consider selling the stock or buying put options. Tickeron's A.I.dvisor looked at 23 similar instances where the indicator moved out of overbought territory. In of the 23 cases, the stock moved lower in the following days. This puts the odds of a move lower at .
The Momentum Indicator moved below the 0 level on November 20, 2025. You may want to consider selling the stock, shorting the stock, or exploring put options on GLM.X as a result. In of 62 cases where the Momentum Indicator fell below 0, the stock fell further within the subsequent month. The odds of a continued downward trend are .
Following a 3-day decline, the stock is projected to fall further. Considering past instances where GLM.X declined for three days, the price rose further in of 62 cases within the following month. The odds of a continued downward trend are .
GLM.X broke above its upper Bollinger Band on November 10, 2025. This could be a sign that the stock is set to drop as the stock moves back below the upper band and toward the middle band. You may want to consider selling the stock or exploring put options.
The Aroon Indicator for GLM.X entered a downward trend on October 17, 2025. This could indicate a strong downward move is ahead for the stock. Traders may want to consider selling the stock or buying put options.
Bullish Trend Analysis
The Stochastic Oscillator suggests the stock price trend may be in a reversal from a downward trend to an upward trend. of 57 cases where GLM.X's Stochastic Oscillator exited the oversold zone resulted in an increase in price. Tickeron's analysis proposes that the odds of a continued upward trend are .
GLM.X moved above its 50-day moving average on November 07, 2025 date and that indicates a change from a downward trend to an upward trend.
The 10-day moving average for GLM.X crossed bullishly above the 50-day moving average on November 11, 2025. This indicates that the trend has shifted higher and could be considered a buy signal. In of 12 past instances when the 10-day crossed above the 50-day, the stock continued to move higher over the following month. The odds of a continued upward trend are .
Following a +1 3-day Advance, the price is estimated to grow further. Considering data from situations where GLM.X advanced for three days, in of 266 cases, the price rose further within the following month. The odds of a continued upward trend are .