GNO.X Crypto Tickeron detected bullish Crypto Pattern: Cup-and-Handle GNO.X on November 01, 2025, netting in a 1.30% gain over 3 weeks


at Tickeron.com


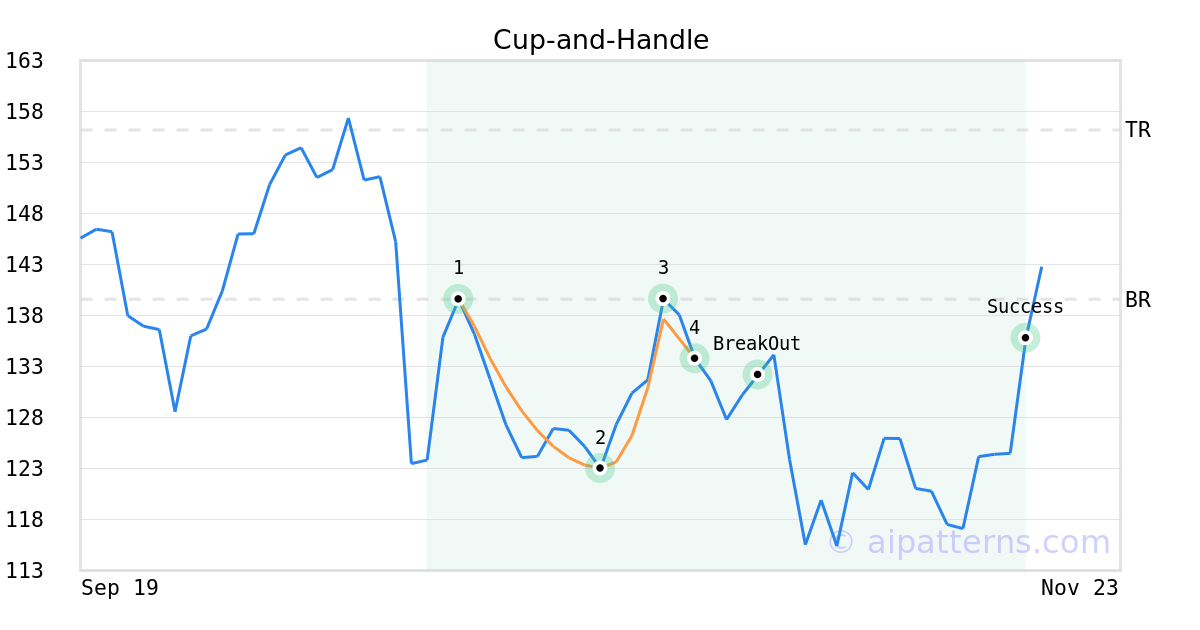
On October 28, 2025, A.I.dvisor detected a Cup-and-Handle Pattern (Bullish) for Gnosis cryptocurrency (GNO.X, $133.921200). On November 01, 2025, A.I.dvisor confirmed the Bullish pattern, setting a target price of $156.190000. 17 days later, on November 18, 2025, GNO.X reached the target price resulting in a for traders who took a long position in the stock.
Aroon Indicator for GNO.X shows an upward move is likely
GNO.X's Aroon Indicator triggered a bullish signal on November 26, 2025. Tickeron's A.I.dvisor detected that the AroonUp green line is above 70 while the AroonDown red line is below 30. When the up indicator moves above 70 and the down indicator remains below 30, it is a sign that the stock could be setting up for a bullish move. Traders may want to buy the stock or look to buy calls options. A.I.dvisor looked at 373 similar instances where the Aroon Indicator showed a similar pattern. In of the 373 cases, the stock moved higher in the days that followed. This puts the odds of a move higher at .

Technical Analysis (Indicators)
Bullish Trend Analysis
The Stochastic Oscillator suggests the stock price trend may be in a reversal from a downward trend to an upward trend. of 78 cases where GNO.X's Stochastic Oscillator exited the oversold zone resulted in an increase in price. Tickeron's analysis proposes that the odds of a continued upward trend are .
The 10-day moving average for GNO.X crossed bullishly above the 50-day moving average on November 25, 2025. This indicates that the trend has shifted higher and could be considered a buy signal. In of 27 past instances when the 10-day crossed above the 50-day, the stock continued to move higher over the following month. The odds of a continued upward trend are .
Following a 3-day Advance, the price is estimated to grow further. Considering data from situations where GNO.X advanced for three days, in of 437 cases, the price rose further within the following month. The odds of a continued upward trend are .
GNO.X may jump back above the lower band and head toward the middle band. Traders may consider buying the stock or exploring call options.
Bearish Trend Analysis
The Momentum Indicator moved below the 0 level on November 28, 2025. You may want to consider selling the stock, shorting the stock, or exploring put options on GNO.X as a result. In of 120 cases where the Momentum Indicator fell below 0, the stock fell further within the subsequent month. The odds of a continued downward trend are .
The Moving Average Convergence Divergence Histogram (MACD) for GNO.X turned negative on December 01, 2025. This could be a sign that the stock is set to turn lower in the coming weeks. Traders may want to sell the stock or buy put options. Tickeron's A.I.dvisor looked at 66 similar instances when the indicator turned negative. In of the 66 cases the stock turned lower in the days that followed. This puts the odds of success at .
GNO.X moved below its 50-day moving average on December 01, 2025 date and that indicates a change from an upward trend to a downward trend.
The 50-day moving average for GNO.X moved below the 200-day moving average on November 22, 2025. This could be a long-term bearish signal for the stock as the stock shifts to an downward trend.
Following a 3-day decline, the stock is projected to fall further. Considering past instances where GNO.X declined for three days, the price rose further in of 62 cases within the following month. The odds of a continued downward trend are .