GPC Stock Tickeron detected bearish Stock Pattern: Broadening Bottom GPC on October 08, 2025, netting in a 3.95% gain over 3 weeks


at Tickeron.com


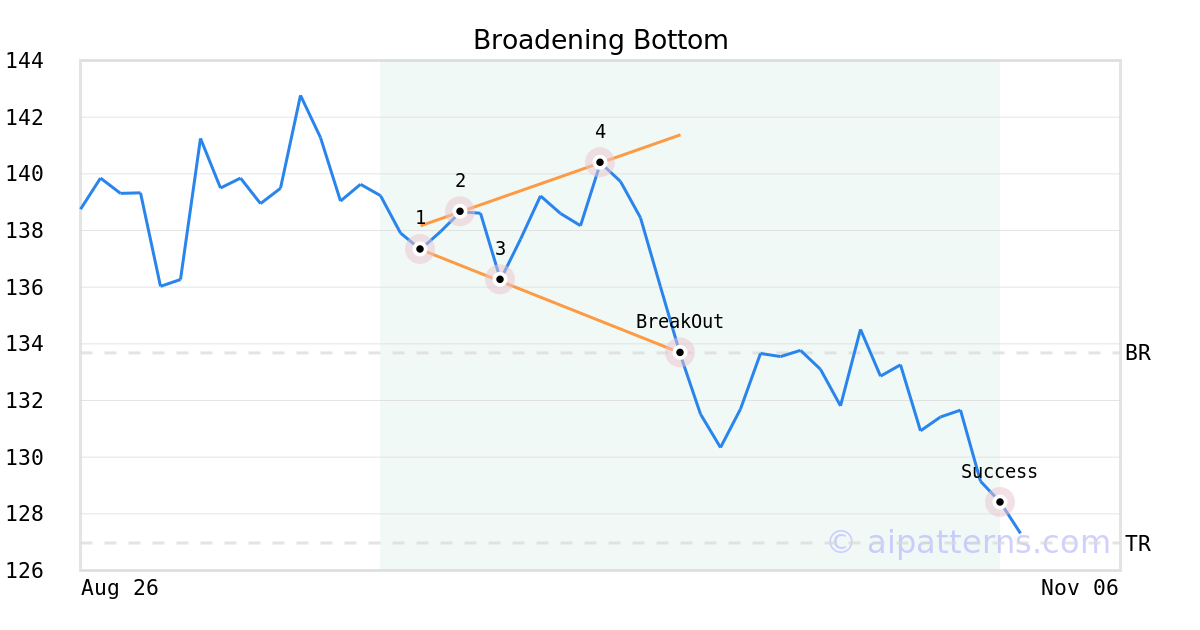
On October 08, 2025, A.I.dvisor detected a Broadening Bottom Pattern (Bearish) for Genuine Parts Company (GPC, $133.68). On October 08, 2025, A.I.dvisor confirmed the Bearish pattern, setting a target price of the stock. On October 30, 2025, the stock hit the target price of $126.97 – resulting in a gain for traders who shorted the stock on the pattern detection date.
GPC in -0.93% downward trend, declining for three consecutive days on November 19, 2025
Moving lower for three straight days is viewed as a bearish sign. Keep an eye on this stock for future declines. Considering data from situations where GPC declined for three days, in of 260 cases, the price declined further within the following month. The odds of a continued downward trend are .

Technical Analysis (Indicators)
Bearish Trend Analysis
The Aroon Indicator for GPC entered a downward trend on November 11, 2025. This could indicate a strong downward move is ahead for the stock. Traders may want to consider selling the stock or buying put options.
Bullish Trend Analysis
The RSI Indicator points to a transition from a downward trend to an upward trend -- in cases where GPC's RSI Oscillator exited the oversold zone, of 24 resulted in an increase in price. Tickeron's analysis proposes that the odds of a continued upward trend are .
The Stochastic Oscillator suggests the stock price trend may be in a reversal from a downward trend to an upward trend. of 50 cases where GPC's Stochastic Oscillator exited the oversold zone resulted in an increase in price. Tickeron's analysis proposes that the odds of a continued upward trend are .
The Momentum Indicator moved above the 0 level on November 17, 2025. You may want to consider a long position or call options on GPC as a result. In of 91 past instances where the momentum indicator moved above 0, the stock continued to climb. The odds of a continued upward trend are .
The Moving Average Convergence Divergence (MACD) for GPC just turned positive on November 12, 2025. Looking at past instances where GPC's MACD turned positive, the stock continued to rise in of 48 cases over the following month. The odds of a continued upward trend are .
Following a 3-day Advance, the price is estimated to grow further. Considering data from situations where GPC advanced for three days, in of 332 cases, the price rose further within the following month. The odds of a continued upward trend are .
GPC may jump back above the lower band and head toward the middle band. Traders may consider buying the stock or exploring call options.
Fundamental Analysis (Ratings)
The Tickeron PE Growth Rating for this company is (best 1 - 100 worst), pointing to outstanding earnings growth. The PE Growth rating is based on a comparative analysis of stock PE ratio increase over the last 12 months compared against S&P 500 index constituents.
The Tickeron Valuation Rating of (best 1 - 100 worst) indicates that the company is slightly undervalued in the industry. This rating compares market capitalization estimated by our proprietary formula with the current market capitalization. This rating is based on the following metrics, as compared to industry averages: P/B Ratio (3.644) is normal, around the industry mean (1.978). P/E Ratio (21.583) is within average values for comparable stocks, (43.398). Projected Growth (PEG Ratio) (1.478) is also within normal values, averaging (1.381). Dividend Yield (0.033) settles around the average of (0.029) among similar stocks. P/S Ratio (0.726) is also within normal values, averaging (84.793).
The Tickeron SMR rating for this company is (best 1 - 100 worst), indicating strong sales and a profitable business model. SMR (Sales, Margin, Return on Equity) rating is based on comparative analysis of weighted Sales, Income Margin and Return on Equity values compared against S&P 500 index constituents. The weighted SMR value is a proprietary formula developed by Tickeron and represents an overall profitability measure for a stock.
The Tickeron Price Growth Rating for this company is (best 1 - 100 worst), indicating fairly steady price growth. GPC’s price grows at a lower rate over the last 12 months as compared to S&P 500 index constituents.
The Tickeron Profit vs. Risk Rating rating for this company is (best 1 - 100 worst), indicating well-balanced risk and returns. The average Profit vs. Risk Rating rating for the industry is 83, placing this stock slightly better than average.
Advertisement
General Information
a distributer of automotive and industrial replacement parts
Industry AutoPartsOEM