HIDV Stock Tickeron detected bearish ETF Pattern: Cup-and-Handle Inverse on November 12, 2025


at Tickeron.com


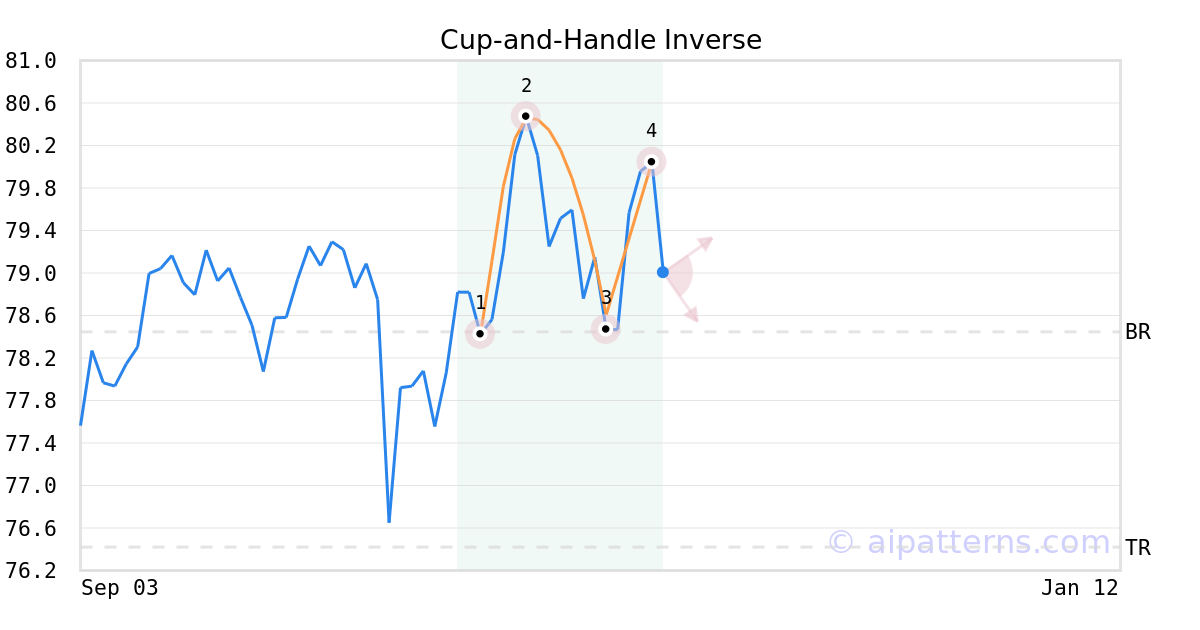
A.I.dvisor detected a bearish Cup-and-Handle Inverse pattern for HIDV stock. This pattern was detected on November 12, 2025 . The odds of reaching the target price are .
The Inverted Cup-and-Handle (sometimes called Inverted Cup-and-Holder) pattern forms when prices rise then decline to create an upside-down “U”like shape (1, 2, 3, also known as the Cup), followed by a shorter relatively straight price increase that bounces from the right lip (from 3 to 4, creating the Handle).
Consider selling the security short or buying a put option at the downward breakout level. The confirmation move is the breakout of the price below the right cup lip.
HIDV in downward trend: 10-day moving average moved below 50-day moving average on November 20, 2025
The 10-day moving average for HIDV crossed bearishly below the 50-day moving average on November 20, 2025. This indicates that the trend has shifted lower and could be considered a sell signal. In of 6 past instances when the 10-day crossed below the 50-day, the stock continued to move higher over the following month. The odds of a continued downward trend are .

Technical Analysis (Indicators)
Bearish Trend Analysis
The Momentum Indicator moved below the 0 level on November 06, 2025. You may want to consider selling the stock, shorting the stock, or exploring put options on HIDV as a result. In of 31 cases where the Momentum Indicator fell below 0, the stock fell further within the subsequent month. The odds of a continued downward trend are .
The Moving Average Convergence Divergence Histogram (MACD) for HIDV turned negative on November 13, 2025. This could be a sign that the stock is set to turn lower in the coming weeks. Traders may want to sell the stock or buy put options. Tickeron's A.I.dvisor looked at 33 similar instances when the indicator turned negative. In of the 33 cases the stock turned lower in the days that followed. This puts the odds of success at .
HIDV moved below its 50-day moving average on November 17, 2025 date and that indicates a change from an upward trend to a downward trend.
Following a 3-day decline, the stock is projected to fall further. Considering past instances where HIDV declined for three days, the price rose further in of 62 cases within the following month. The odds of a continued downward trend are .
Bullish Trend Analysis
The RSI Indicator points to a transition from a downward trend to an upward trend -- in cases where HIDV's RSI Oscillator exited the oversold zone, of 12 resulted in an increase in price. Tickeron's analysis proposes that the odds of a continued upward trend are .
The Stochastic Oscillator shows that the ticker has stayed in the oversold zone for 4 days. The price of this ticker is presumed to bounce back soon, since the longer the ticker stays in the oversold zone, the more promptly an upward trend is expected.
Following a 3-day Advance, the price is estimated to grow further. Considering data from situations where HIDV advanced for three days, in of 188 cases, the price rose further within the following month. The odds of a continued upward trend are .
HIDV may jump back above the lower band and head toward the middle band. Traders may consider buying the stock or exploring call options.
Advertisement
General Information
Category LargeValue