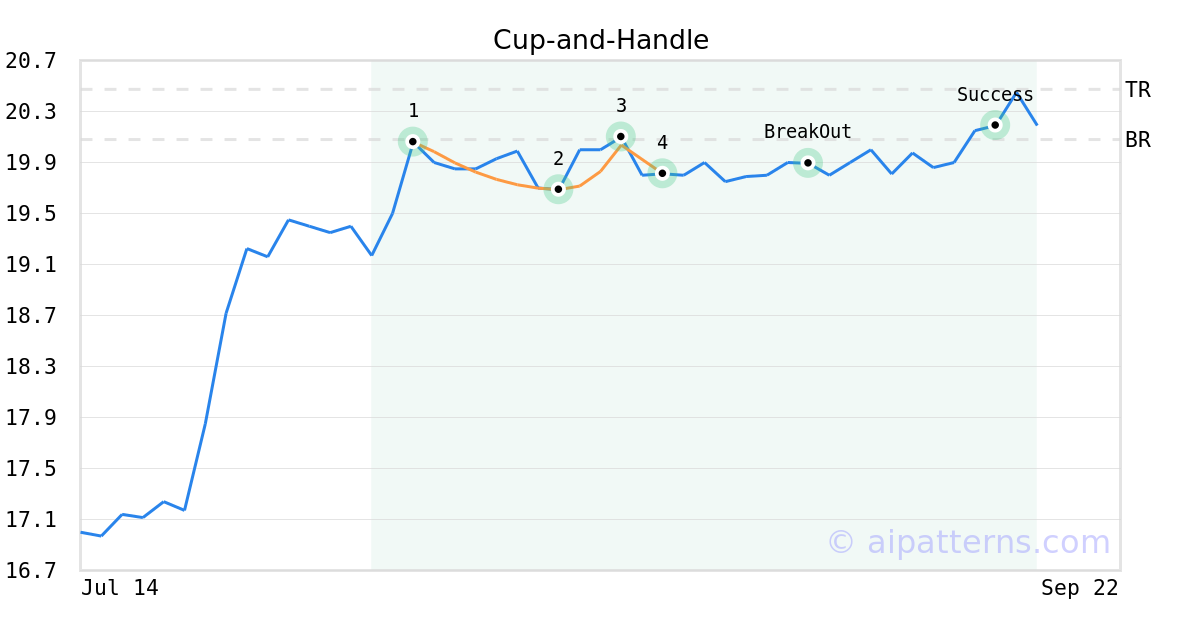
HOVNP Stock Tickeron detected bullish Stock Pattern: Cup-and-Handle HOVNP on September 02, 2025, netting in a 1.91% gain over 3 weeks


at Tickeron.com


Aroon Indicator for HOVNP shows an upward move is likely
HOVNP's Aroon Indicator triggered a bullish signal on October 06, 2025. Tickeron's A.I.dvisor detected that the AroonUp green line is above 70 while the AroonDown red line is below 30. When the up indicator moves above 70 and the down indicator remains below 30, it is a sign that the stock could be setting up for a bullish move. Traders may want to buy the stock or look to buy calls options. A.I.dvisor looked at 204 similar instances where the Aroon Indicator showed a similar pattern. In of the 204 cases, the stock moved higher in the days that followed. This puts the odds of a move higher at .

Technical Analysis (Indicators)
Bullish Trend Analysis
The Momentum Indicator moved above the 0 level on September 04, 2025. You may want to consider a long position or call options on HOVNP as a result. In of 136 past instances where the momentum indicator moved above 0, the stock continued to climb. The odds of a continued upward trend are .
The Moving Average Convergence Divergence (MACD) for HOVNP just turned positive on October 02, 2025. Looking at past instances where HOVNP's MACD turned positive, the stock continued to rise in of 54 cases over the following month. The odds of a continued upward trend are .
Following a 3-day Advance, the price is estimated to grow further. Considering data from situations where HOVNP advanced for three days, in of 186 cases, the price rose further within the following month. The odds of a continued upward trend are .
Bearish Trend Analysis
The RSI Indicator demonstrates that the ticker has stayed in the overbought zone for 3 days. The longer the ticker stays in the overbought zone, the sooner a price pull-back is expected.
The Stochastic Oscillator may be shifting from an upward trend to a downward trend. In of 62 cases where HOVNP's Stochastic Oscillator exited the overbought zone, the price fell further within the following month. The odds of a continued downward trend are .
Following a 3-day decline, the stock is projected to fall further. Considering past instances where HOVNP declined for three days, the price rose further in of 62 cases within the following month. The odds of a continued downward trend are .
HOVNP broke above its upper Bollinger Band on October 03, 2025. This could be a sign that the stock is set to drop as the stock moves back below the upper band and toward the middle band. You may want to consider selling the stock or exploring put options.
Fundamental Analysis (Ratings)
The Tickeron Valuation Rating of (best 1 - 100 worst) indicates that the company is seriously undervalued in the industry. This rating compares market capitalization estimated by our proprietary formula with the current market capitalization. This rating is based on the following metrics, as compared to industry averages: P/B Ratio (0.000) is normal, around the industry mean (19.475). P/E Ratio (0.000) is within average values for comparable stocks, (54.989). Projected Growth (PEG Ratio) (0.000) is also within normal values, averaging (1.421). HOVNP's Dividend Yield (0.092) is considerably higher than the industry average of (0.037). P/S Ratio (0.000) is also within normal values, averaging (24.312).
The Tickeron Profit vs. Risk Rating rating for this company is (best 1 - 100 worst), indicating low risk on high returns. The average Profit vs. Risk Rating rating for the industry is 71, placing this stock better than average.
The Tickeron Price Growth Rating for this company is (best 1 - 100 worst), indicating steady price growth. HOVNP’s price grows at a higher rate over the last 12 months as compared to S&P 500 index constituents.
The Tickeron PE Growth Rating for this company is (best 1 - 100 worst), pointing to worse than average earnings growth. The PE Growth rating is based on a comparative analysis of stock PE ratio increase over the last 12 months compared against S&P 500 index constituents.
The Tickeron SMR rating for this company is (best 1 - 100 worst), indicating weak sales and an unprofitable business model. SMR (Sales, Margin, Return on Equity) rating is based on comparative analysis of weighted Sales, Income Margin and Return on Equity values compared against S&P 500 index constituents. The weighted SMR value is a proprietary formula developed by Tickeron and represents an overall profitability measure for a stock.


Advertisement
General Information
a homebuilding company
Industry Homebuilding