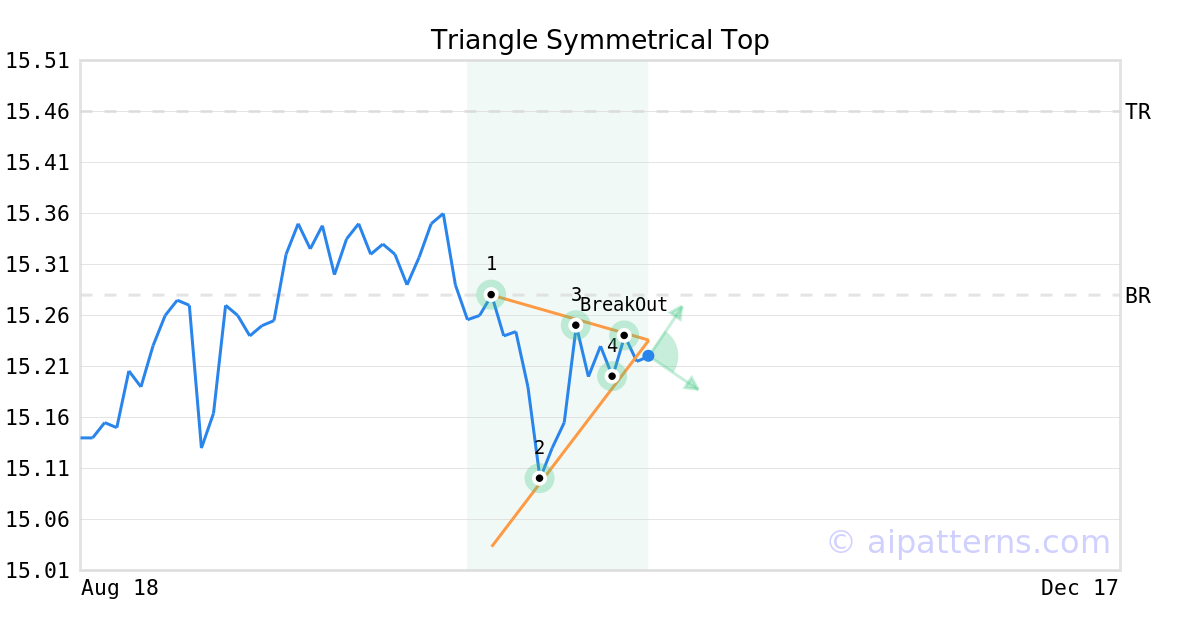
HYSA Stock Tickeron detected bullish ETF Pattern: Triangle Symmetrical Top on October 21, 2025


at Tickeron.com


HYSA's RSI Oscillator recovers from oversold territory
The RSI Indicator for HYSA moved out of oversold territory on October 13, 2025. This could be a sign that the stock is shifting from a downward trend to an upward trend. Traders may want to buy the stock or call options. The A.I.dvisor looked at 3 similar instances when the indicator left oversold territory. In of the 3 cases the stock moved higher. This puts the odds of a move higher at .

Technical Analysis (Indicators)
Bullish Trend Analysis
The Stochastic Oscillator suggests the stock price trend may be in a reversal from a downward trend to an upward trend. of 20 cases where HYSA's Stochastic Oscillator exited the oversold zone resulted in an increase in price. Tickeron's analysis proposes that the odds of a continued upward trend are .
The Momentum Indicator moved above the 0 level on October 23, 2025. You may want to consider a long position or call options on HYSA as a result. In of 43 past instances where the momentum indicator moved above 0, the stock continued to climb. The odds of a continued upward trend are .
The Moving Average Convergence Divergence (MACD) for HYSA just turned positive on October 24, 2025. Looking at past instances where HYSA's MACD turned positive, the stock continued to rise in of 20 cases over the following month. The odds of a continued upward trend are .
HYSA moved above its 50-day moving average on October 14, 2025 date and that indicates a change from a downward trend to an upward trend.
Following a 3-day Advance, the price is estimated to grow further. Considering data from situations where HYSA advanced for three days, in of 114 cases, the price rose further within the following month. The odds of a continued upward trend are .
HYSA may jump back above the lower band and head toward the middle band. Traders may consider buying the stock or exploring call options.
Bearish Trend Analysis
Following a 3-day decline, the stock is projected to fall further. Considering past instances where HYSA declined for three days, the price rose further in of 62 cases within the following month. The odds of a continued downward trend are .
The Aroon Indicator for HYSA entered a downward trend on October 21, 2025. This could indicate a strong downward move is ahead for the stock. Traders may want to consider selling the stock or buying put options.


Advertisement
General Information
Category HighYieldBond