IEX Stock Tickeron detected bearish Stock Pattern: Head-and-Shoulders Top on November 10, 2025


at Tickeron.com


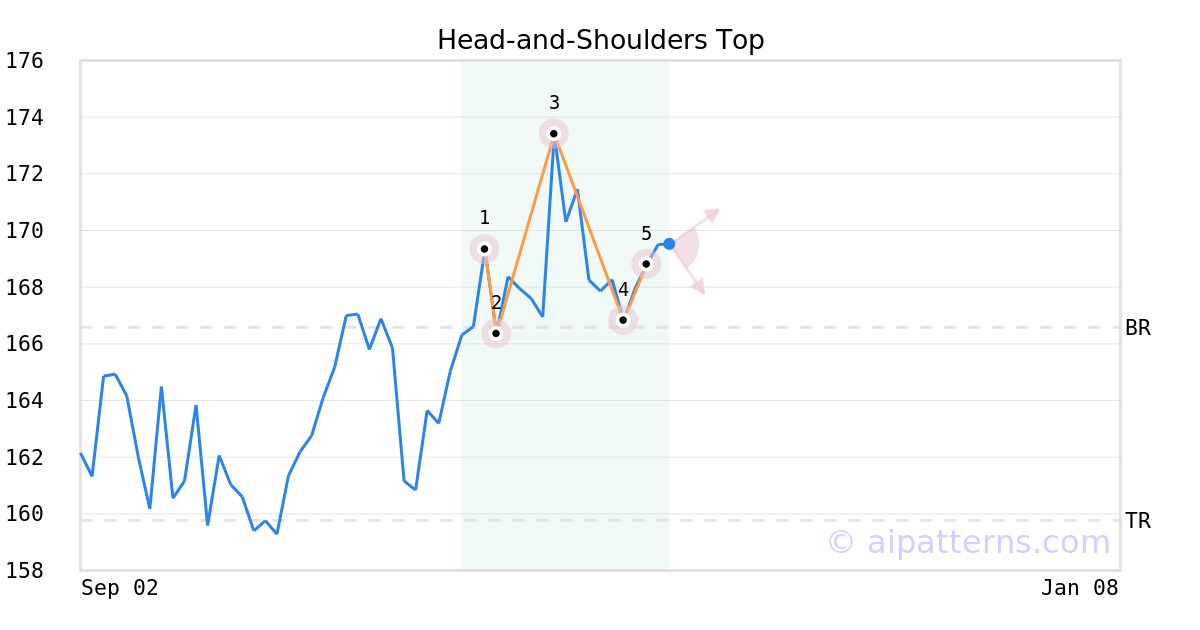
A.I.dvisor detected a bearish Head-and-Shoulders Top pattern for IEX stock. This pattern was detected on November 10, 2025 . The odds of reaching the target price are 6.
The pattern forms with a center peak (the Head, labeled 3) and left and right Shoulders (1, 5). Eventually the security stops testing highs and reverses trend into a decline.
Consider selling a security short before it declines or buying a put option to benefit from the price decline. To improve success chances, wait for a confirmation move: allow the price to break below the Neckline level (2, 4), which is calculated as the average of the two lows between the Head and the Shoulders.
IEX in downward trend: price dove below 50-day moving average on November 14, 2025
IEX moved below its 50-day moving average on November 14, 2025 date and that indicates a change from an upward trend to a downward trend. In of 52 similar past instances, the stock price decreased further within the following month. The odds of a continued downward trend are .

Technical Analysis (Indicators)
Bearish Trend Analysis
The 10-day RSI Indicator for IEX moved out of overbought territory on October 30, 2025. This could be a bearish sign for the stock. Traders may want to consider selling the stock or buying put options. Tickeron's A.I.dvisor looked at 28 similar instances where the indicator moved out of overbought territory. In of the 28 cases, the stock moved lower in the following days. This puts the odds of a move lower at .
The Momentum Indicator moved below the 0 level on November 12, 2025. You may want to consider selling the stock, shorting the stock, or exploring put options on IEX as a result. In of 98 cases where the Momentum Indicator fell below 0, the stock fell further within the subsequent month. The odds of a continued downward trend are .
The Moving Average Convergence Divergence Histogram (MACD) for IEX turned negative on November 05, 2025. This could be a sign that the stock is set to turn lower in the coming weeks. Traders may want to sell the stock or buy put options. Tickeron's A.I.dvisor looked at 54 similar instances when the indicator turned negative. In of the 54 cases the stock turned lower in the days that followed. This puts the odds of success at .
Following a 3-day decline, the stock is projected to fall further. Considering past instances where IEX declined for three days, the price rose further in of 62 cases within the following month. The odds of a continued downward trend are .
Bullish Trend Analysis
The Stochastic Oscillator shows that the ticker has stayed in the oversold zone for 11 days. The price of this ticker is presumed to bounce back soon, since the longer the ticker stays in the oversold zone, the more promptly an upward trend is expected.
Following a 3-day Advance, the price is estimated to grow further. Considering data from situations where IEX advanced for three days, in of 293 cases, the price rose further within the following month. The odds of a continued upward trend are .
IEX may jump back above the lower band and head toward the middle band. Traders may consider buying the stock or exploring call options.
The Aroon Indicator entered an Uptrend today. In of 194 cases where IEX Aroon's Indicator entered an Uptrend, the price rose further within the following month. The odds of a continued Uptrend are .
Fundamental Analysis (Ratings)
The Tickeron Valuation Rating of (best 1 - 100 worst) indicates that the company is fair valued in the industry. This rating compares market capitalization estimated by our proprietary formula with the current market capitalization. This rating is based on the following metrics, as compared to industry averages: P/B Ratio (3.041) is normal, around the industry mean (4.978). P/E Ratio (25.791) is within average values for comparable stocks, (65.217). Projected Growth (PEG Ratio) (1.584) is also within normal values, averaging (2.261). Dividend Yield (0.017) settles around the average of (0.023) among similar stocks. P/S Ratio (3.602) is also within normal values, averaging (62.441).
The Tickeron Seasonality Score of (best 1 - 100 worst) indicates that the company is fair valued in the industry. The Tickeron Seasonality score describes the variance of predictable price changes around the same period every calendar year. These changes can be tied to a specific month, quarter, holiday or vacation period, as well as a meteorological or growing season.
The Tickeron SMR rating for this company is (best 1 - 100 worst), indicating strong sales and a profitable business model. SMR (Sales, Margin, Return on Equity) rating is based on comparative analysis of weighted Sales, Income Margin and Return on Equity values compared against S&P 500 index constituents. The weighted SMR value is a proprietary formula developed by Tickeron and represents an overall profitability measure for a stock.
The Tickeron Price Growth Rating for this company is (best 1 - 100 worst), indicating fairly steady price growth. IEX’s price grows at a lower rate over the last 12 months as compared to S&P 500 index constituents.
The Tickeron PE Growth Rating for this company is (best 1 - 100 worst), pointing to worse than average earnings growth. The PE Growth rating is based on a comparative analysis of stock PE ratio increase over the last 12 months compared against S&P 500 index constituents.
The Tickeron Profit vs. Risk Rating rating for this company is (best 1 - 100 worst), indicating that the returns do not compensate for the risks. IEX’s unstable profits reported over time resulted in significant Drawdowns within these last five years. A stable profit reduces stock drawdown and volatility. The average Profit vs. Risk Rating rating for the industry is 72, placing this stock worse than average.
Advertisement
General Information
a manufacturer of industrial pumps and other engineering equipment
Industry IndustrialMachinery