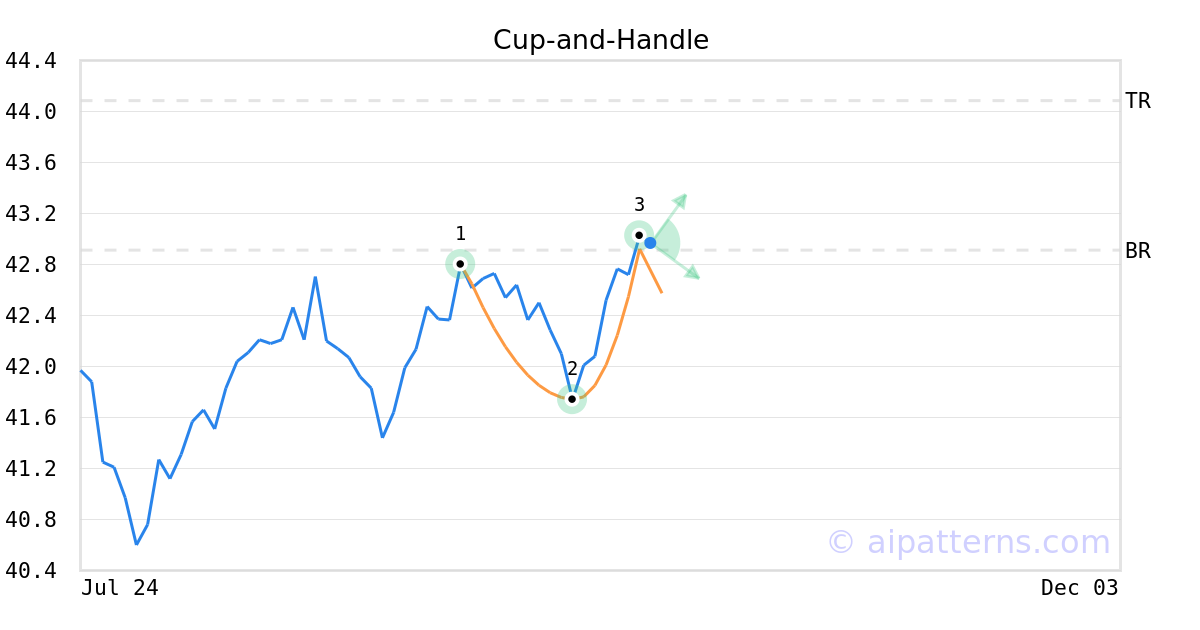
ILOW Stock Tickeron detected bullish ETF Pattern: Cup-and-Handle on October 07, 2025


at Tickeron.com


Momentum Indicator for ILOW turns positive, indicating new upward trend
ILOW saw its Momentum Indicator move above the 0 level on October 23, 2025. This is an indication that the stock could be shifting in to a new upward move. Traders may want to consider buying the stock or buying call options. Tickeron's A.I.dvisor looked at 19 similar instances where the indicator turned positive. In of the 19 cases, the stock moved higher in the following days. The odds of a move higher are at .

Technical Analysis (Indicators)
Bullish Trend Analysis
The Moving Average Convergence Divergence (MACD) for ILOW just turned positive on October 24, 2025. Looking at past instances where ILOW's MACD turned positive, the stock continued to rise in of 15 cases over the following month. The odds of a continued upward trend are .
ILOW moved above its 50-day moving average on October 22, 2025 date and that indicates a change from a downward trend to an upward trend.
The 10-day moving average for ILOW crossed bullishly above the 50-day moving average on October 23, 2025. This indicates that the trend has shifted higher and could be considered a buy signal. In of 4 past instances when the 10-day crossed above the 50-day, the stock continued to move higher over the following month. The odds of a continued upward trend are .
Following a 3-day Advance, the price is estimated to grow further. Considering data from situations where ILOW advanced for three days, in of 78 cases, the price rose further within the following month. The odds of a continued upward trend are .
ILOW may jump back above the lower band and head toward the middle band. Traders may consider buying the stock or exploring call options.
The Aroon Indicator entered an Uptrend today. In of 64 cases where ILOW Aroon's Indicator entered an Uptrend, the price rose further within the following month. The odds of a continued Uptrend are .
Bearish Trend Analysis
The Stochastic Oscillator has been in the overbought zone for 1 day. Expect a price pull-back in the near future.
Following a 3-day decline, the stock is projected to fall further. Considering past instances where ILOW declined for three days, the price rose further in of 62 cases within the following month. The odds of a continued downward trend are .


Advertisement