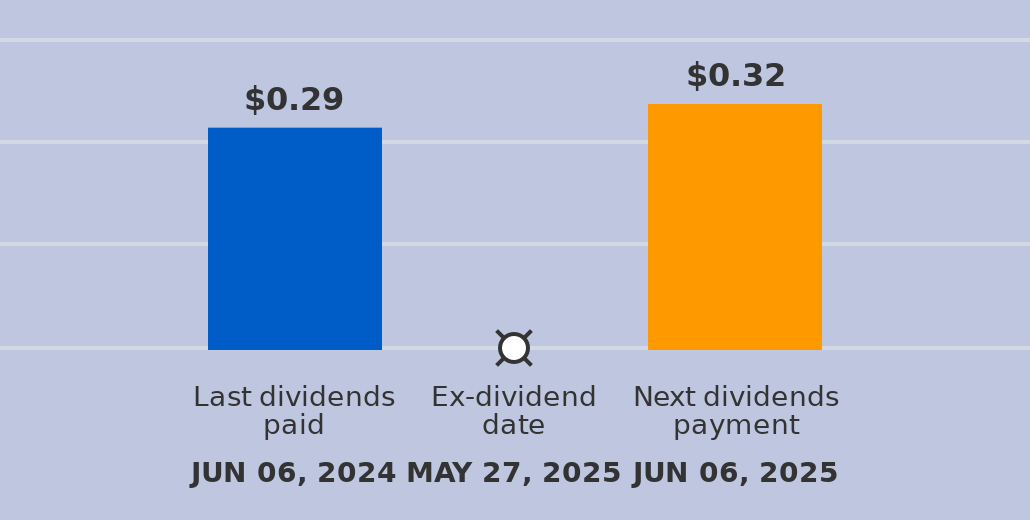
IMYSY Stock IMERYS SA (IMYSY) is expected to pay dividends on June 06, 2025


at Tickeron.com
IMYSY in downward trend: price dove below 50-day moving average on October 16, 2025
IMYSY moved below its 50-day moving average on October 16, 2025 date and that indicates a change from an upward trend to a downward trend. In of 6 similar past instances, the stock price decreased further within the following month. The odds of a continued downward trend are .

Technical Analysis (Indicators)
Bearish Trend Analysis
The Momentum Indicator moved below the 0 level on October 16, 2025. You may want to consider selling the stock, shorting the stock, or exploring put options on IMYSY as a result. In of 11 cases where the Momentum Indicator fell below 0, the stock fell further within the subsequent month. The odds of a continued downward trend are .
The Moving Average Convergence Divergence Histogram (MACD) for IMYSY turned negative on September 18, 2025. This could be a sign that the stock is set to turn lower in the coming weeks. Traders may want to sell the stock or buy put options. Tickeron's A.I.dvisor looked at 9 similar instances when the indicator turned negative. In of the 9 cases the stock turned lower in the days that followed. This puts the odds of success at .
Bullish Trend Analysis
The RSI Indicator points to a transition from a downward trend to an upward trend -- in cases where IMYSY's RSI Oscillator exited the oversold zone, of 6 resulted in an increase in price. Tickeron's analysis proposes that the odds of a continued upward trend are .
The Stochastic Oscillator suggests the stock price trend may be in a reversal from a downward trend to an upward trend. of 9 cases where IMYSY's Stochastic Oscillator exited the oversold zone resulted in an increase in price. Tickeron's analysis proposes that the odds of a continued upward trend are .
Fundamental Analysis (Ratings)
The Tickeron Valuation Rating of (best 1 - 100 worst) indicates that the company is seriously undervalued in the industry. This rating compares market capitalization estimated by our proprietary formula with the current market capitalization. This rating is based on the following metrics, as compared to industry averages: P/B Ratio (0.617) is normal, around the industry mean (2.251). IMYSY's P/E Ratio (168.970) is considerably higher than the industry average of (33.014). IMYSY's Projected Growth (PEG Ratio) (0.000) is slightly lower than the industry average of (1.961). Dividend Yield (0.062) settles around the average of (0.040) among similar stocks. P/S Ratio (0.564) is also within normal values, averaging (32.027).
The Tickeron Price Growth Rating for this company is (best 1 - 100 worst), indicating slightly worse than average price growth. IMYSY’s price grows at a lower rate over the last 12 months as compared to S&P 500 index constituents.
The Tickeron PE Growth Rating for this company is (best 1 - 100 worst), pointing to worse than average earnings growth. The PE Growth rating is based on a comparative analysis of stock PE ratio increase over the last 12 months compared against S&P 500 index constituents.
The Tickeron SMR rating for this company is (best 1 - 100 worst), indicating weak sales and an unprofitable business model. SMR (Sales, Margin, Return on Equity) rating is based on comparative analysis of weighted Sales, Income Margin and Return on Equity values compared against S&P 500 index constituents. The weighted SMR value is a proprietary formula developed by Tickeron and represents an overall profitability measure for a stock.
The Tickeron Profit vs. Risk Rating rating for this company is (best 1 - 100 worst), indicating that the returns do not compensate for the risks. IMYSY’s unstable profits reported over time resulted in significant Drawdowns within these last five years. A stable profit reduces stock drawdown and volatility. The average Profit vs. Risk Rating rating for the industry is 66, placing this stock worse than average.


Advertisement