IP Stock Tickeron detected bearish Stock Pattern: Triangle Descending IP on September 10, 2025, netting in a 20.53% gain over 1 month


at Tickeron.com


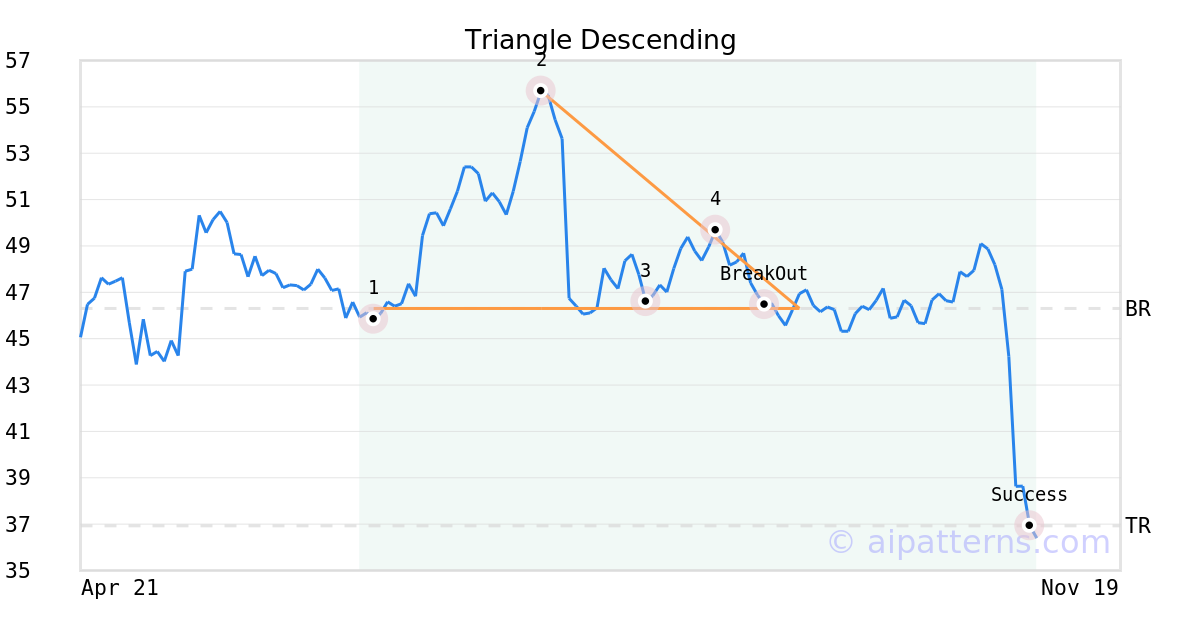
On September 10, 2025, A.I.dvisor detected a Triangle Descending Pattern (Bearish) for International Paper Co (IP, $46.47). On September 10, 2025, A.I.dvisor confirmed the Bearish pattern, setting a target price of the stock. On November 03, 2025, the stock hit the target price of $36.93 – resulting in a +2 gain for traders who shorted the stock on the pattern detection date.
IP in -1.97% downward trend, declining for three consecutive days on November 17, 2025
Moving lower for three straight days is viewed as a bearish sign. Keep an eye on this stock for future declines. Considering data from situations where IP declined for three days, in of 293 cases, the price declined further within the following month. The odds of a continued downward trend are .

Technical Analysis (Indicators)
Bearish Trend Analysis
IP moved below its 50-day moving average on October 28, 2025 date and that indicates a change from an upward trend to a downward trend.
The 10-day moving average for IP crossed bearishly below the 50-day moving average on October 30, 2025. This indicates that the trend has shifted lower and could be considered a sell signal. In of 20 past instances when the 10-day crossed below the 50-day, the stock continued to move higher over the following month. The odds of a continued downward trend are .
The Aroon Indicator for IP entered a downward trend on October 15, 2025. This could indicate a strong downward move is ahead for the stock. Traders may want to consider selling the stock or buying put options.
Bullish Trend Analysis
The RSI Indicator demonstrates that the ticker has stayed in the oversold zone for 2 days, which means it's wise to expect a price bounce in the near future.
The Stochastic Oscillator suggests the stock price trend may be in a reversal from a downward trend to an upward trend. of 60 cases where IP's Stochastic Oscillator exited the oversold zone resulted in an increase in price. Tickeron's analysis proposes that the odds of a continued upward trend are .
The Momentum Indicator moved above the 0 level on November 17, 2025. You may want to consider a long position or call options on IP as a result. In of 92 past instances where the momentum indicator moved above 0, the stock continued to climb. The odds of a continued upward trend are .
The Moving Average Convergence Divergence (MACD) for IP just turned positive on November 19, 2025. Looking at past instances where IP's MACD turned positive, the stock continued to rise in of 42 cases over the following month. The odds of a continued upward trend are .
Following a 3-day Advance, the price is estimated to grow further. Considering data from situations where IP advanced for three days, in of 311 cases, the price rose further within the following month. The odds of a continued upward trend are .
IP may jump back above the lower band and head toward the middle band. Traders may consider buying the stock or exploring call options.
Fundamental Analysis (Ratings)
The Tickeron PE Growth Rating for this company is (best 1 - 100 worst), pointing to outstanding earnings growth. The PE Growth rating is based on a comparative analysis of stock PE ratio increase over the last 12 months compared against S&P 500 index constituents.
The Tickeron Valuation Rating of (best 1 - 100 worst) indicates that the company is slightly undervalued in the industry. This rating compares market capitalization estimated by our proprietary formula with the current market capitalization. This rating is based on the following metrics, as compared to industry averages: P/B Ratio (1.110) is normal, around the industry mean (3.831). IP's P/E Ratio (45.838) is considerably higher than the industry average of (19.716). Projected Growth (PEG Ratio) (1.141) is also within normal values, averaging (0.810). Dividend Yield (0.051) settles around the average of (0.044) among similar stocks. P/S Ratio (0.692) is also within normal values, averaging (1.693).
The Tickeron Price Growth Rating for this company is (best 1 - 100 worst), indicating fairly steady price growth. IP’s price grows at a lower rate over the last 12 months as compared to S&P 500 index constituents.
The Tickeron Profit vs. Risk Rating rating for this company is (best 1 - 100 worst), indicating that the returns do not compensate for the risks. IP’s unstable profits reported over time resulted in significant Drawdowns within these last five years. A stable profit reduces stock drawdown and volatility. The average Profit vs. Risk Rating rating for the industry is 89, placing this stock worse than average.
The Tickeron SMR rating for this company is (best 1 - 100 worst), indicating weak sales and an unprofitable business model. SMR (Sales, Margin, Return on Equity) rating is based on comparative analysis of weighted Sales, Income Margin and Return on Equity values compared against S&P 500 index constituents. The weighted SMR value is a proprietary formula developed by Tickeron and represents an overall profitability measure for a stock.
Advertisement
General Information
a manufacturer of paper and packaging products
Industry ContainersPackaging