IRMD Stock Tickeron detected bullish Stock Pattern: Triangle Symmetrical Bottom IRMD on October 21, 2025, netting in a 14.54% gain over 2 weeks


at Tickeron.com


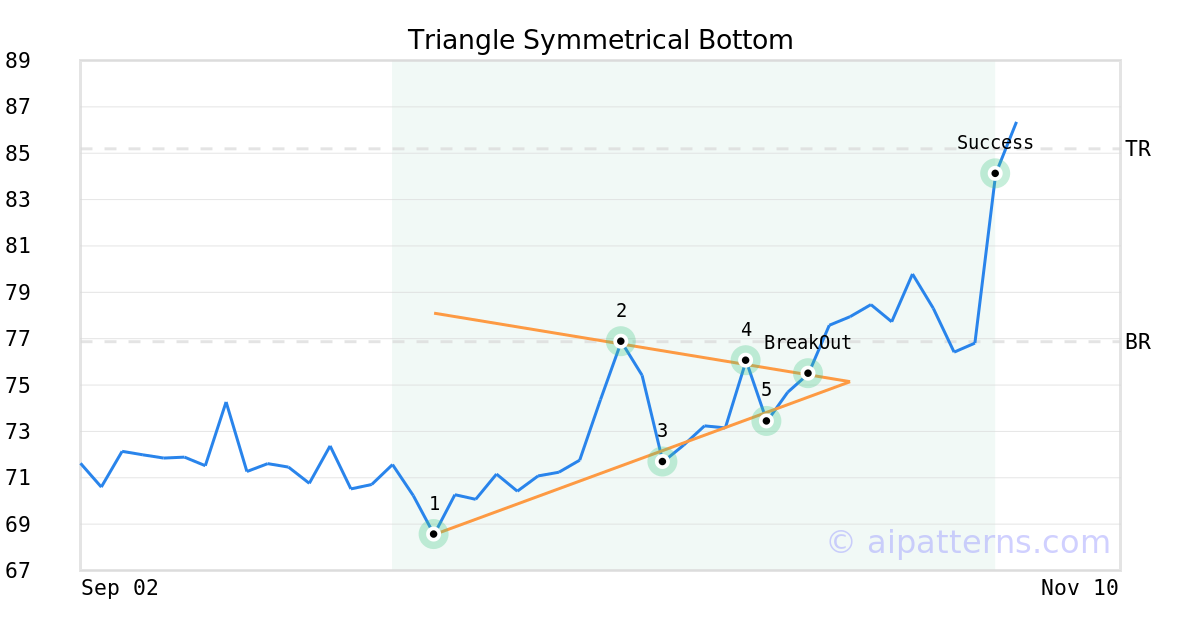
On October 17, 2025, A.I.dvisor detected a Triangle Symmetrical Bottom Pattern (Bullish) for iRadimed Corp (IRMD, $73.43). On October 21, 2025, A.I.dvisor confirmed the Bullish pattern, setting a target price of $85.19. 13 days later, on November 03, 2025, IRMD reached the target price resulting in a +1 for traders who took a long position in the stock.
Aroon Indicator for IRMD shows an upward move is likely
IRMD's Aroon Indicator triggered a bullish signal on November 13, 2025. Tickeron's A.I.dvisor detected that the AroonUp green line is above 70 while the AroonDown red line is below 30. When the up indicator moves above 70 and the down indicator remains below 30, it is a sign that the stock could be setting up for a bullish move. Traders may want to buy the stock or look to buy calls options. A.I.dvisor looked at 230 similar instances where the Aroon Indicator showed a similar pattern. In of the 230 cases, the stock moved higher in the days that followed. This puts the odds of a move higher at .

Technical Analysis (Indicators)
Bullish Trend Analysis
Following a 3-day Advance, the price is estimated to grow further. Considering data from situations where IRMD advanced for three days, in of 257 cases, the price rose further within the following month. The odds of a continued upward trend are .
Bearish Trend Analysis
The 10-day RSI Indicator for IRMD moved out of overbought territory on November 05, 2025. This could be a bearish sign for the stock. Traders may want to consider selling the stock or buying put options. Tickeron's A.I.dvisor looked at 33 similar instances where the indicator moved out of overbought territory. In of the 33 cases, the stock moved lower in the following days. This puts the odds of a move lower at .
The Stochastic Oscillator entered the overbought zone. Expect a price pull-back in the foreseeable future.
The Momentum Indicator moved below the 0 level on November 18, 2025. You may want to consider selling the stock, shorting the stock, or exploring put options on IRMD as a result. In of 120 cases where the Momentum Indicator fell below 0, the stock fell further within the subsequent month. The odds of a continued downward trend are .
Following a 3-day decline, the stock is projected to fall further. Considering past instances where IRMD declined for three days, the price rose further in of 62 cases within the following month. The odds of a continued downward trend are .
IRMD broke above its upper Bollinger Band on November 03, 2025. This could be a sign that the stock is set to drop as the stock moves back below the upper band and toward the middle band. You may want to consider selling the stock or exploring put options.
Fundamental Analysis (Ratings)
The Tickeron PE Growth Rating for this company is (best 1 - 100 worst), pointing to outstanding earnings growth. The PE Growth rating is based on a comparative analysis of stock PE ratio increase over the last 12 months compared against S&P 500 index constituents.
The Tickeron Profit vs. Risk Rating rating for this company is (best 1 - 100 worst), indicating low risk on high returns. The average Profit vs. Risk Rating rating for the industry is 94, placing this stock better than average.
The Tickeron Price Growth Rating for this company is (best 1 - 100 worst), indicating steady price growth. IRMD’s price grows at a higher rate over the last 12 months as compared to S&P 500 index constituents.
The Tickeron SMR rating for this company is (best 1 - 100 worst), indicating strong sales and a profitable business model. SMR (Sales, Margin, Return on Equity) rating is based on comparative analysis of weighted Sales, Income Margin and Return on Equity values compared against S&P 500 index constituents. The weighted SMR value is a proprietary formula developed by Tickeron and represents an overall profitability measure for a stock.
The Tickeron Valuation Rating of (best 1 - 100 worst) indicates that the company is fair valued in the industry. This rating compares market capitalization estimated by our proprietary formula with the current market capitalization. This rating is based on the following metrics, as compared to industry averages: P/B Ratio (11.050) is normal, around the industry mean (63.027). P/E Ratio (51.764) is within average values for comparable stocks, (35.851). IRMD's Projected Growth (PEG Ratio) (0.000) is slightly lower than the industry average of (1.651). IRMD has a moderately low Dividend Yield (0.008) as compared to the industry average of (0.019). P/S Ratio (13.624) is also within normal values, averaging (60.827).
Advertisement
General Information
a provider of non-magnetic intravenous infusion pump systems
Industry MedicalNursingServices