ISBA Stock Tickeron detected bullish Stock Pattern: Triangle Descending on October 29, 2025


at Tickeron.com


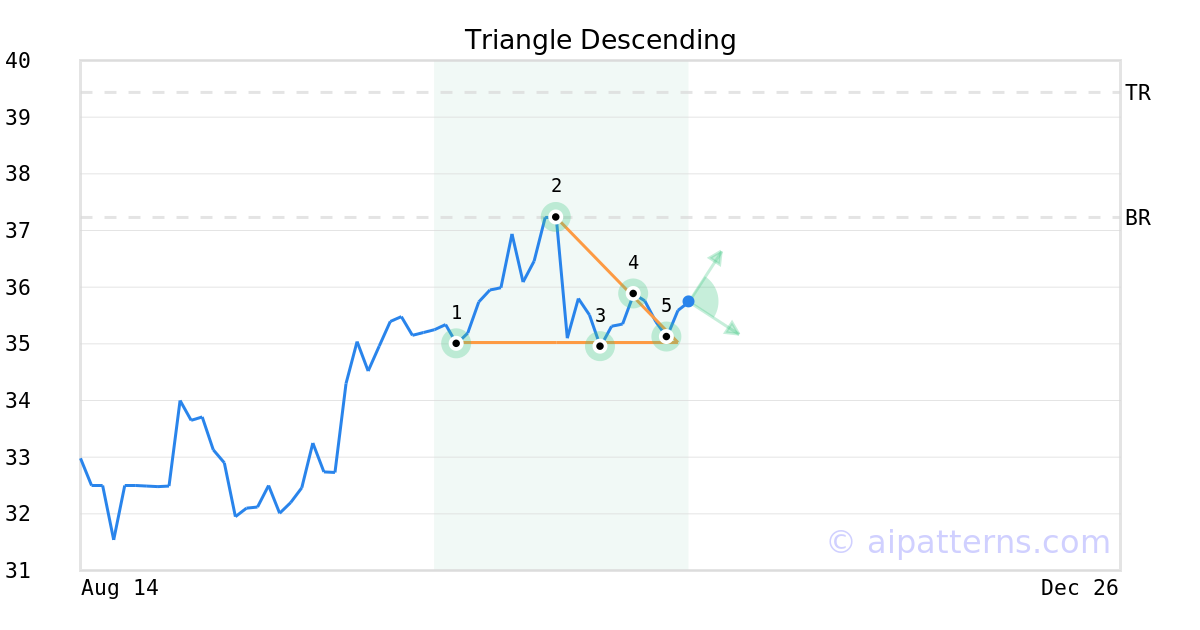
A.I.dvisor detected a bullish Triangle Descending pattern for ISBA stock. This pattern was detected on October 29, 2025 . The odds of reaching the target price are .
The Descending Triangle pattern is formed when the price of a security establishes a support level (1, 3, 5) and bounces off that level to a declining resistance level, creating a down-sloping top line (2, 4).
Consider buying a security or call option at the breakout price level. When trading, wait for the confirmation move, which is when the price rises above the breakout level.
ISBA in +6.72% Uptrend, growing for three consecutive days on December 01, 2025
Moving higher for three straight days is viewed as a bullish sign. Keep an eye on this stock for future growth. Considering data from situations where ISBA advanced for three days, in of 194 cases, the price rose further within the following month. The odds of a continued upward trend are .

Technical Analysis (Indicators)
Bullish Trend Analysis
The Momentum Indicator moved above the 0 level on November 20, 2025. You may want to consider a long position or call options on ISBA as a result. In of 117 past instances where the momentum indicator moved above 0, the stock continued to climb. The odds of a continued upward trend are .
The Moving Average Convergence Divergence (MACD) for ISBA just turned positive on December 01, 2025. Looking at past instances where ISBA's MACD turned positive, the stock continued to rise in of 52 cases over the following month. The odds of a continued upward trend are .
The Aroon Indicator entered an Uptrend today. In of 173 cases where ISBA Aroon's Indicator entered an Uptrend, the price rose further within the following month. The odds of a continued Uptrend are .
Bearish Trend Analysis
The 10-day RSI Indicator for ISBA moved out of overbought territory on November 24, 2025. This could be a bearish sign for the stock. Traders may want to consider selling the stock or buying put options. Tickeron's A.I.dvisor looked at 37 similar instances where the indicator moved out of overbought territory. In of the 37 cases, the stock moved lower in the following days. This puts the odds of a move lower at .
The Stochastic Oscillator may be shifting from an upward trend to a downward trend. In of 63 cases where ISBA's Stochastic Oscillator exited the overbought zone, the price fell further within the following month. The odds of a continued downward trend are .
Following a 3-day decline, the stock is projected to fall further. Considering past instances where ISBA declined for three days, the price rose further in of 62 cases within the following month. The odds of a continued downward trend are .
ISBA broke above its upper Bollinger Band on November 21, 2025. This could be a sign that the stock is set to drop as the stock moves back below the upper band and toward the middle band. You may want to consider selling the stock or exploring put options.
Fundamental Analysis (Ratings)
The Tickeron Profit vs. Risk Rating rating for this company is (best 1 - 100 worst), indicating low risk on high returns. The average Profit vs. Risk Rating rating for the industry is 52, placing this stock better than average.
The Tickeron PE Growth Rating for this company is (best 1 - 100 worst), pointing to outstanding earnings growth. The PE Growth rating is based on a comparative analysis of stock PE ratio increase over the last 12 months compared against S&P 500 index constituents.
The Tickeron Price Growth Rating for this company is (best 1 - 100 worst), indicating steady price growth. ISBA’s price grows at a higher rate over the last 12 months as compared to S&P 500 index constituents.
The Tickeron SMR rating for this company is (best 1 - 100 worst), indicating slightly weaker than average sales and a marginally profitable business model. SMR (Sales, Margin, Return on Equity) rating is based on comparative analysis of weighted Sales, Income Margin and Return on Equity values compared against S&P 500 index constituents. The weighted SMR value is a proprietary formula developed by Tickeron and represents an overall profitability measure for a stock.
The Tickeron Valuation Rating of (best 1 - 100 worst) indicates that the company is slightly overvalued in the industry. This rating compares market capitalization estimated by our proprietary formula with the current market capitalization. This rating is based on the following metrics, as compared to industry averages: P/B Ratio (1.458) is normal, around the industry mean (1.126). P/E Ratio (18.378) is within average values for comparable stocks, (18.319). Projected Growth (PEG Ratio) (0.000) is also within normal values, averaging (3.224). Dividend Yield (0.025) settles around the average of (0.036) among similar stocks. P/S Ratio (4.600) is also within normal values, averaging (5.230).
Advertisement