MENU
JPI
AS OF
Sep 19 closing price
Price
$20.68
Change
-$0.04 (-0.19%)
Net Assets
287.11M
Intraday BUY SELL Signals
JPI Stock Nuveen Preferred Securities & Income Opportunities Fund (JPI) is expected to pay dividends on October 01, 2025


A.I.dvisor
at Tickeron.com
at Tickeron.com
Buy or Sell
View Daily SignalsLoading...
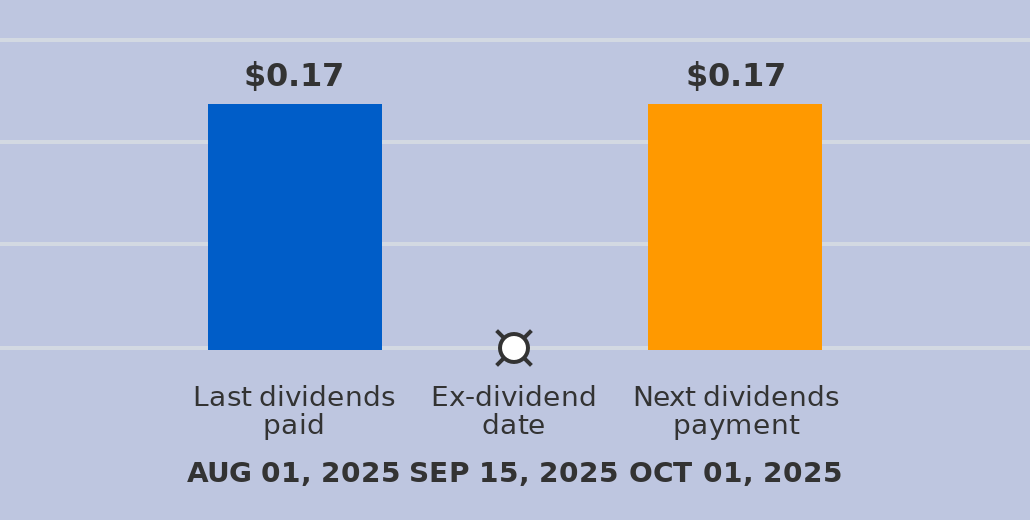
A dividend of $0.17 per share will be paid with a record date of October 01, 2025, and an ex-dividend date of September 15, 2025. The last dividend of $0.17 was paid on August 01, 2025. The ex-dividend date is usually set several business days before the record date. If a stock is purchased on its ex-dividend date or after, the next dividend payment will not be received. Instead, the dividends are repossessed by to the seller. If the stocks are purchased before the ex-dividend date, the buyer will receive the dividends.
View a ticker or compare two or three
VS
VS
Interact to see
Advertisement
Advertisement
A.I.Advisor
published price charts
These past five trading days, the ETF lost 0.00% with an average daily volume of 0 shares traded.The ETF tracked a drawdown of 0% for this period.
A.I. Advisor
published General Information
General Information
Category Unknown
Profile
Fundamentals
Details
Category
Preferred Stock
Address
333 West Wacker DriveChicago
Phone
N/A
Web
www.nuveen.com