JPUS Stock Tickeron detected bearish ETF Pattern: Cup-and-Handle Inverse on November 18, 2025


at Tickeron.com


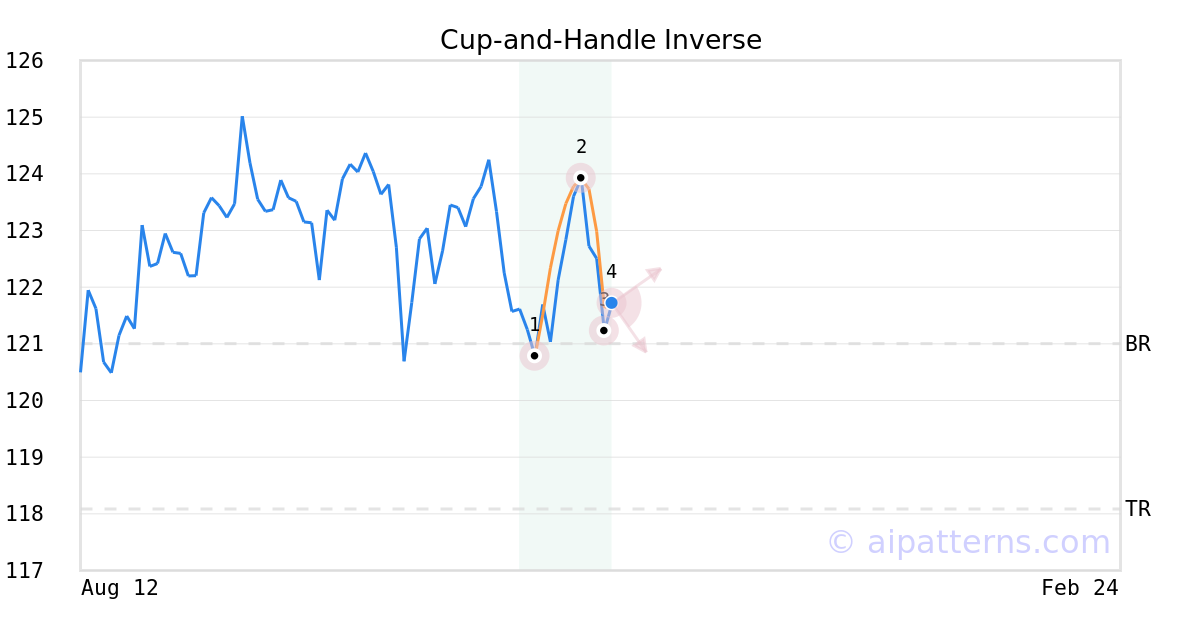
A.I.dvisor detected a bearish Cup-and-Handle Inverse pattern for JPUS stock. This pattern was detected on November 18, 2025 . The odds of reaching the target price are 6.
The Inverted Cup-and-Handle (sometimes called Inverted Cup-and-Holder) pattern forms when prices rise then decline to create an upside-down “U”like shape (1, 2, 3, also known as the Cup), followed by a shorter relatively straight price increase that bounces from the right lip (from 3 to 4, creating the Handle).
Consider selling the security short or buying a put option at the downward breakout level. The confirmation move is the breakout of the price below the right cup lip.
JPUS sees MACD Histogram just turned negative
JPUS saw its Moving Average Convergence Divergence Histogram (MACD) turn negative on November 17, 2025. This is a bearish signal that suggests the stock could decline going forward. Tickeron's A.I.dvisor looked at 52 instances where the indicator turned negative. In of the 52 cases the stock moved lower in the days that followed. This puts the odds of a downward move at .

Technical Analysis (Indicators)
Bearish Trend Analysis
The Momentum Indicator moved below the 0 level on November 19, 2025. You may want to consider selling the stock, shorting the stock, or exploring put options on JPUS as a result. In of 82 cases where the Momentum Indicator fell below 0, the stock fell further within the subsequent month. The odds of a continued downward trend are .
JPUS moved below its 50-day moving average on November 13, 2025 date and that indicates a change from an upward trend to a downward trend.
The 10-day moving average for JPUS crossed bearishly below the 50-day moving average on November 03, 2025. This indicates that the trend has shifted lower and could be considered a sell signal. In of 13 past instances when the 10-day crossed below the 50-day, the stock continued to move higher over the following month. The odds of a continued downward trend are .
Following a 3-day decline, the stock is projected to fall further. Considering past instances where JPUS declined for three days, the price rose further in of 62 cases within the following month. The odds of a continued downward trend are .
The Aroon Indicator for JPUS entered a downward trend on November 10, 2025. This could indicate a strong downward move is ahead for the stock. Traders may want to consider selling the stock or buying put options.
Bullish Trend Analysis
The Stochastic Oscillator is in the oversold zone. Keep an eye out for a move up in the foreseeable future.
Following a 3-day Advance, the price is estimated to grow further. Considering data from situations where JPUS advanced for three days, in of 339 cases, the price rose further within the following month. The odds of a continued upward trend are .
Advertisement
General Information
Category MidCapValue