KBE Stock Tickeron detected bullish ETF Pattern: Broadening Wedge Descending KBE on November 24, 2025, netting in a 7.68% gain over 1 month


at Tickeron.com


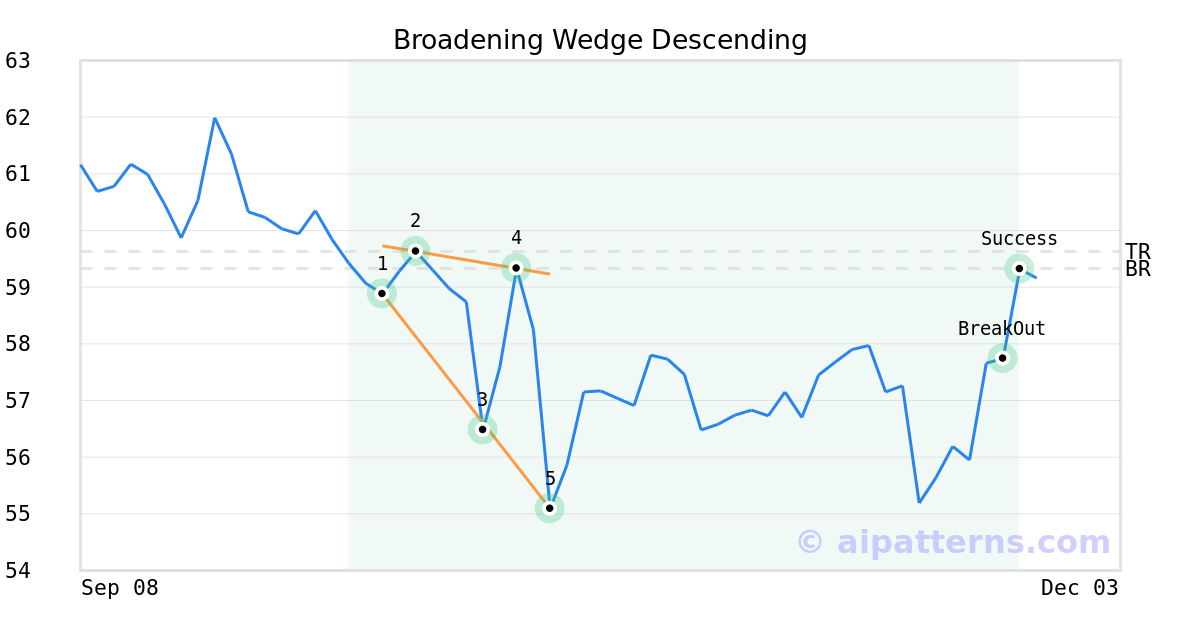
On October 16, 2025, A.I.dvisor detected a Broadening Wedge Descending Pattern (Bullish) for State Street® SPDR® S&P® Bank ETF (KBE, $55.09). On November 24, 2025, A.I.dvisor confirmed the Bullish pattern, setting a target price of $59.63. 1 day later, on November 25, 2025, KBE reached the target price resulting in a for traders who took a long position in the stock.
KBE's MACD Histogram just turned positive
The Moving Average Convergence Divergence (MACD) for KBE turned positive on November 21, 2025. Looking at past instances where KBE's MACD turned positive, the stock continued to rise in of 43 cases over the following month. The odds of a continued upward trend are .

Technical Analysis (Indicators)
Bullish Trend Analysis
The Momentum Indicator moved above the 0 level on November 21, 2025. You may want to consider a long position or call options on KBE as a result. In of 80 past instances where the momentum indicator moved above 0, the stock continued to climb. The odds of a continued upward trend are .
KBE moved above its 50-day moving average on November 25, 2025 date and that indicates a change from a downward trend to an upward trend.
Following a 3-day Advance, the price is estimated to grow further. Considering data from situations where KBE advanced for three days, in of 296 cases, the price rose further within the following month. The odds of a continued upward trend are .
Bearish Trend Analysis
The Stochastic Oscillator demonstrated that the ticker has stayed in the overbought zone for 3 days. The longer the ticker stays in the overbought zone, the sooner a price pull-back is expected.
Following a 3-day decline, the stock is projected to fall further. Considering past instances where KBE declined for three days, the price rose further in of 62 cases within the following month. The odds of a continued downward trend are .
KBE broke above its upper Bollinger Band on November 25, 2025. This could be a sign that the stock is set to drop as the stock moves back below the upper band and toward the middle band. You may want to consider selling the stock or exploring put options.
The Aroon Indicator for KBE entered a downward trend on October 27, 2025. This could indicate a strong downward move is ahead for the stock. Traders may want to consider selling the stock or buying put options.
Advertisement
General Information
Category Financial