KDRN Stock Tickeron detected bullish ETF Pattern: Three Rising Valleys on April 09, 2025


at Tickeron.com


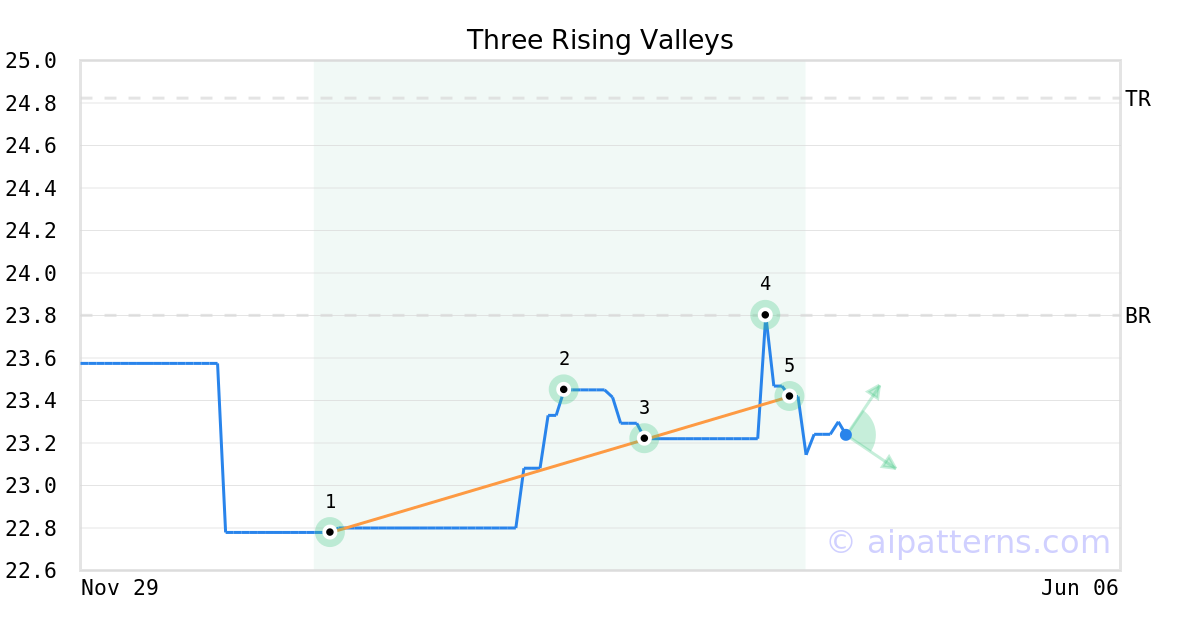
A.I.dvisor detected a bullish Three Rising Valleys pattern for KDRN stock. This pattern was detected on April 09, 2025 . The odds of reaching the target price are 6.
The Three Rising Valleys pattern forms when three minor Lows (1, 3, 5) are arranged along an upward sloping trend line.
Consider buying a security or call option at the breakout price level. When trading, wait for the confirmation move, which is when the price rises above the breakout level.
Momentum Indicator for KDRN turns positive, indicating new upward trend
KDRN saw its Momentum Indicator move above the 0 level on November 18, 2025. This is an indication that the stock could be shifting in to a new upward move. Traders may want to consider buying the stock or buying call options. Tickeron's A.I.dvisor looked at 62 similar instances where the indicator turned positive. In of the 62 cases, the stock moved higher in the following days. The odds of a move higher are at .

Technical Analysis (Indicators)
Bullish Trend Analysis
The Stochastic Oscillator suggests the stock price trend may be in a reversal from a downward trend to an upward trend. of 42 cases where KDRN's Stochastic Oscillator exited the oversold zone resulted in an increase in price. Tickeron's analysis proposes that the odds of a continued upward trend are .
KDRN moved above its 50-day moving average on October 31, 2025 date and that indicates a change from a downward trend to an upward trend.
The 10-day moving average for KDRN crossed bullishly above the 50-day moving average on November 03, 2025. This indicates that the trend has shifted higher and could be considered a buy signal. In of 11 past instances when the 10-day crossed above the 50-day, the stock continued to move higher over the following month. The odds of a continued upward trend are .
Following a 3-day Advance, the price is estimated to grow further. Considering data from situations where KDRN advanced for three days, in of 179 cases, the price rose further within the following month. The odds of a continued upward trend are .
The Aroon Indicator entered an Uptrend today. In of 166 cases where KDRN Aroon's Indicator entered an Uptrend, the price rose further within the following month. The odds of a continued Uptrend are .
Bearish Trend Analysis
The RSI Indicator demonstrates that the ticker has stayed in the overbought zone for 3 days. The longer the ticker stays in the overbought zone, the sooner a price pull-back is expected.
The Moving Average Convergence Divergence Histogram (MACD) for KDRN turned negative on November 20, 2025. This could be a sign that the stock is set to turn lower in the coming weeks. Traders may want to sell the stock or buy put options. Tickeron's A.I.dvisor looked at 33 similar instances when the indicator turned negative. In of the 33 cases the stock turned lower in the days that followed. This puts the odds of success at .
Advertisement
General Information
Category IntermediateTermBond