KLIC Stock Tickeron detected bullish Stock Pattern: Wedge Rising KLIC on September 08, 2025, netting in a 14.75% gain over 2 months


at Tickeron.com


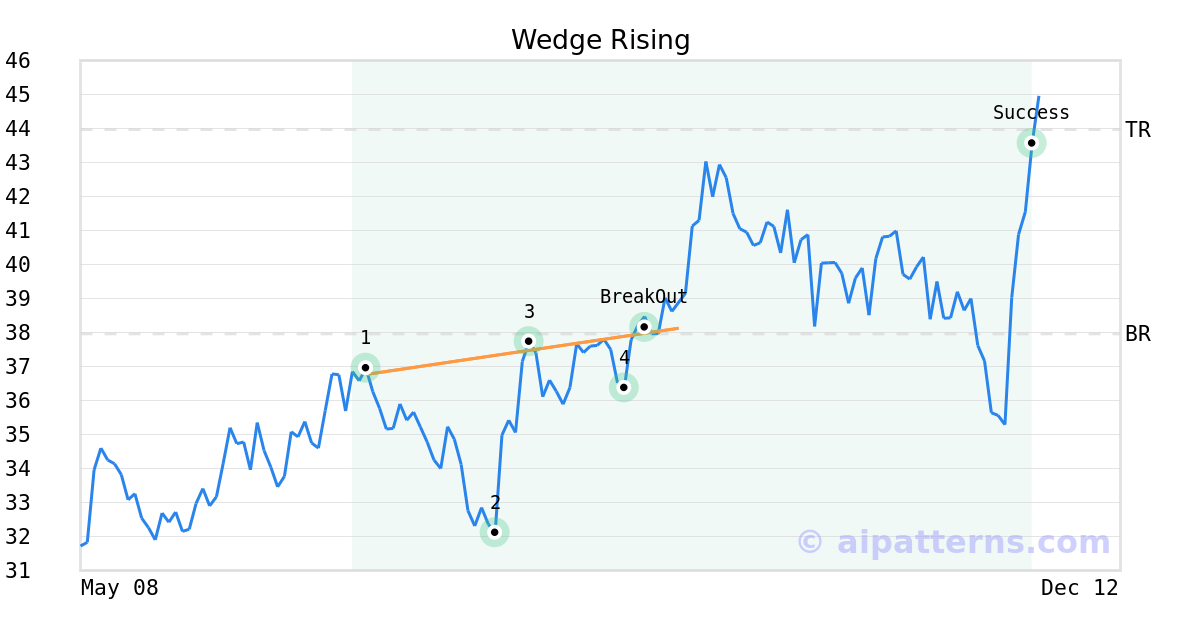
On September 08, 2025, A.I.dvisor detected a Wedge Rising Pattern (Bullish) for Kulicke and Soffa Industries (KLIC, $37.96). On September 08, 2025, A.I.dvisor confirmed the Bullish pattern, setting a target price of $43.97. 78 days later, on November 25, 2025, KLIC reached the target price resulting in a +1 for traders who took a long position in the stock.
KLIC in upward trend: price rose above 50-day moving average on November 21, 2025
KLIC moved above its 50-day moving average on November 21, 2025 date and that indicates a change from a downward trend to an upward trend. In of 48 similar past instances, the stock price increased further within the following month. The odds of a continued upward trend are .

Technical Analysis (Indicators)
Bullish Trend Analysis
The Momentum Indicator moved above the 0 level on November 20, 2025. You may want to consider a long position or call options on KLIC as a result. In of 90 past instances where the momentum indicator moved above 0, the stock continued to climb. The odds of a continued upward trend are .
The Moving Average Convergence Divergence (MACD) for KLIC just turned positive on November 21, 2025. Looking at past instances where KLIC's MACD turned positive, the stock continued to rise in of 52 cases over the following month. The odds of a continued upward trend are .
Following a 3-day Advance, the price is estimated to grow further. Considering data from situations where KLIC advanced for three days, in of 294 cases, the price rose further within the following month. The odds of a continued upward trend are .
Bearish Trend Analysis
The RSI Indicator has been in the overbought zone for 2 days. Expect a price pull-back in the near future.
The Stochastic Oscillator demonstrated that the ticker has stayed in the overbought zone for 3 days. The longer the ticker stays in the overbought zone, the sooner a price pull-back is expected.
The 10-day moving average for KLIC crossed bearishly below the 50-day moving average on November 07, 2025. This indicates that the trend has shifted lower and could be considered a sell signal. In of 17 past instances when the 10-day crossed below the 50-day, the stock continued to move higher over the following month. The odds of a continued downward trend are .
Following a 3-day decline, the stock is projected to fall further. Considering past instances where KLIC declined for three days, the price rose further in of 62 cases within the following month. The odds of a continued downward trend are .
KLIC broke above its upper Bollinger Band on November 25, 2025. This could be a sign that the stock is set to drop as the stock moves back below the upper band and toward the middle band. You may want to consider selling the stock or exploring put options.
The Aroon Indicator for KLIC entered a downward trend on November 11, 2025. This could indicate a strong downward move is ahead for the stock. Traders may want to consider selling the stock or buying put options.
Fundamental Analysis (Ratings)
The Tickeron PE Growth Rating for this company is (best 1 - 100 worst), pointing to average earnings growth. The PE Growth rating is based on a comparative analysis of stock PE ratio increase over the last 12 months compared against S&P 500 index constituents.
The Tickeron Price Growth Rating for this company is (best 1 - 100 worst), indicating steady price growth. KLIC’s price grows at a higher rate over the last 12 months as compared to S&P 500 index constituents.
The Tickeron Profit vs. Risk Rating rating for this company is (best 1 - 100 worst), indicating that the returns do not compensate for the risks. KLIC’s unstable profits reported over time resulted in significant Drawdowns within these last five years. A stable profit reduces stock drawdown and volatility. The average Profit vs. Risk Rating rating for the industry is 69, placing this stock better than average.
The Tickeron Valuation Rating of (best 1 - 100 worst) indicates that the company is slightly overvalued in the industry. This rating compares market capitalization estimated by our proprietary formula with the current market capitalization. This rating is based on the following metrics, as compared to industry averages: P/B Ratio (2.875) is normal, around the industry mean (7.890). KLIC's P/E Ratio (391.333) is considerably higher than the industry average of (50.111). KLIC's Projected Growth (PEG Ratio) (0.000) is slightly lower than the industry average of (2.110). KLIC has a moderately high Dividend Yield (0.018) as compared to the industry average of (0.011). P/S Ratio (3.668) is also within normal values, averaging (37.302).
The Tickeron SMR rating for this company is (best 1 - 100 worst), indicating weak sales and an unprofitable business model. SMR (Sales, Margin, Return on Equity) rating is based on comparative analysis of weighted Sales, Income Margin and Return on Equity values compared against S&P 500 index constituents. The weighted SMR value is a proprietary formula developed by Tickeron and represents an overall profitability measure for a stock.
The Tickeron Seasonality Score of (best 1 - 100 worst) indicates that the company is significantly overvalued in the industry. The Tickeron Seasonality score describes the variance of predictable price changes around the same period every calendar year. These changes can be tied to a specific month, quarter, holiday or vacation period, as well as a meteorological or growing season.
Advertisement
General Information
a manufacturer of capital equipment and expendable tools
Industry ElectronicProductionEquipment