KTB Stock Tickeron detected bearish Stock Pattern: Broadening Bottom KTB on October 09, 2025, netting in a 6.30% gain over 4 weeks


at Tickeron.com


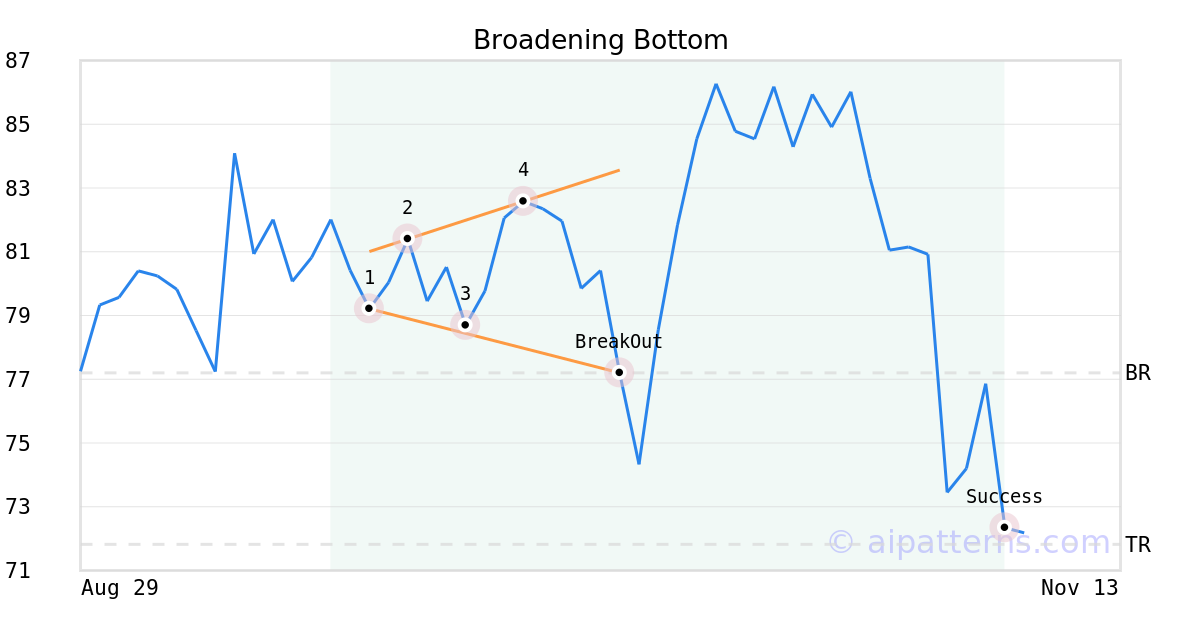
On October 09, 2025, A.I.dvisor detected a Broadening Bottom Pattern (Bearish) for Kontoor Brands (KTB, $77.20). On October 09, 2025, A.I.dvisor confirmed the Bearish pattern, setting a target price of the stock. On November 06, 2025, the stock hit the target price of $71.82 – resulting in a gain for traders who shorted the stock on the pattern detection date.
KTB in downward trend: price dove below 50-day moving average on November 03, 2025
KTB moved below its 50-day moving average on November 03, 2025 date and that indicates a change from an upward trend to a downward trend. In of 48 similar past instances, the stock price decreased further within the following month. The odds of a continued downward trend are .

Technical Analysis (Indicators)
Bearish Trend Analysis
The Momentum Indicator moved below the 0 level on October 29, 2025. You may want to consider selling the stock, shorting the stock, or exploring put options on KTB as a result. In of 87 cases where the Momentum Indicator fell below 0, the stock fell further within the subsequent month. The odds of a continued downward trend are .
The Moving Average Convergence Divergence Histogram (MACD) for KTB turned negative on October 29, 2025. This could be a sign that the stock is set to turn lower in the coming weeks. Traders may want to sell the stock or buy put options. Tickeron's A.I.dvisor looked at 46 similar instances when the indicator turned negative. In of the 46 cases the stock turned lower in the days that followed. This puts the odds of success at .
The 10-day moving average for KTB crossed bearishly below the 50-day moving average on November 06, 2025. This indicates that the trend has shifted lower and could be considered a sell signal. In of 15 past instances when the 10-day crossed below the 50-day, the stock continued to move higher over the following month. The odds of a continued downward trend are .
Following a 3-day decline, the stock is projected to fall further. Considering past instances where KTB declined for three days, the price rose further in of 62 cases within the following month. The odds of a continued downward trend are .
Bullish Trend Analysis
The RSI Indicator points to a transition from a downward trend to an upward trend -- in cases where KTB's RSI Indicator exited the oversold zone, of 22 resulted in an increase in price. Tickeron's analysis proposes that the odds of a continued upward trend are .
The Stochastic Oscillator shows that the ticker has stayed in the oversold zone for 14 days. The price of this ticker is presumed to bounce back soon, since the longer the ticker stays in the oversold zone, the more promptly an upward trend is expected.
Following a 3-day Advance, the price is estimated to grow further. Considering data from situations where KTB advanced for three days, in of 335 cases, the price rose further within the following month. The odds of a continued upward trend are .
KTB may jump back above the lower band and head toward the middle band. Traders may consider buying the stock or exploring call options.
Fundamental Analysis (Ratings)
The Tickeron SMR rating for this company is (best 1 - 100 worst), indicating very strong sales and a profitable business model. SMR (Sales, Margin, Return on Equity) rating is based on comparative analysis of weighted Sales, Income Margin and Return on Equity values compared against S&P 500 index constituents. The weighted SMR value is a proprietary formula developed by Tickeron and represents an overall profitability measure for a stock.
The Tickeron Valuation Rating of (best 1 - 100 worst) indicates that the company is slightly undervalued in the industry. This rating compares market capitalization estimated by our proprietary formula with the current market capitalization. This rating is based on the following metrics, as compared to industry averages: P/B Ratio (7.267) is normal, around the industry mean (4.766). P/E Ratio (17.848) is within average values for comparable stocks, (25.500). KTB's Projected Growth (PEG Ratio) (0.000) is slightly lower than the industry average of (1.682). Dividend Yield (0.030) settles around the average of (0.035) among similar stocks. P/S Ratio (1.369) is also within normal values, averaging (1.178).
The Tickeron Profit vs. Risk Rating rating for this company is (best 1 - 100 worst), indicating well-balanced risk and returns. The average Profit vs. Risk Rating rating for the industry is 82, placing this stock slightly better than average.
The Tickeron Seasonality Score of (best 1 - 100 worst) indicates that the company is fair valued in the industry. The Tickeron Seasonality score describes the variance of predictable price changes around the same period every calendar year. These changes can be tied to a specific month, quarter, holiday or vacation period, as well as a meteorological or growing season.
The Tickeron PE Growth Rating for this company is (best 1 - 100 worst), pointing to average earnings growth. The PE Growth rating is based on a comparative analysis of stock PE ratio increase over the last 12 months compared against S&P 500 index constituents.
The Tickeron Price Growth Rating for this company is (best 1 - 100 worst), indicating slightly worse than average price growth. KTB’s price grows at a lower rate over the last 12 months as compared to S&P 500 index constituents.
Advertisement
General Information
a company, which engages in the manufacture and sale of apparel
Industry ApparelFootwear