LMAT Stock Tickeron detected bullish Stock Pattern: Head-and-Shoulders Bottom on November 14, 2025


at Tickeron.com


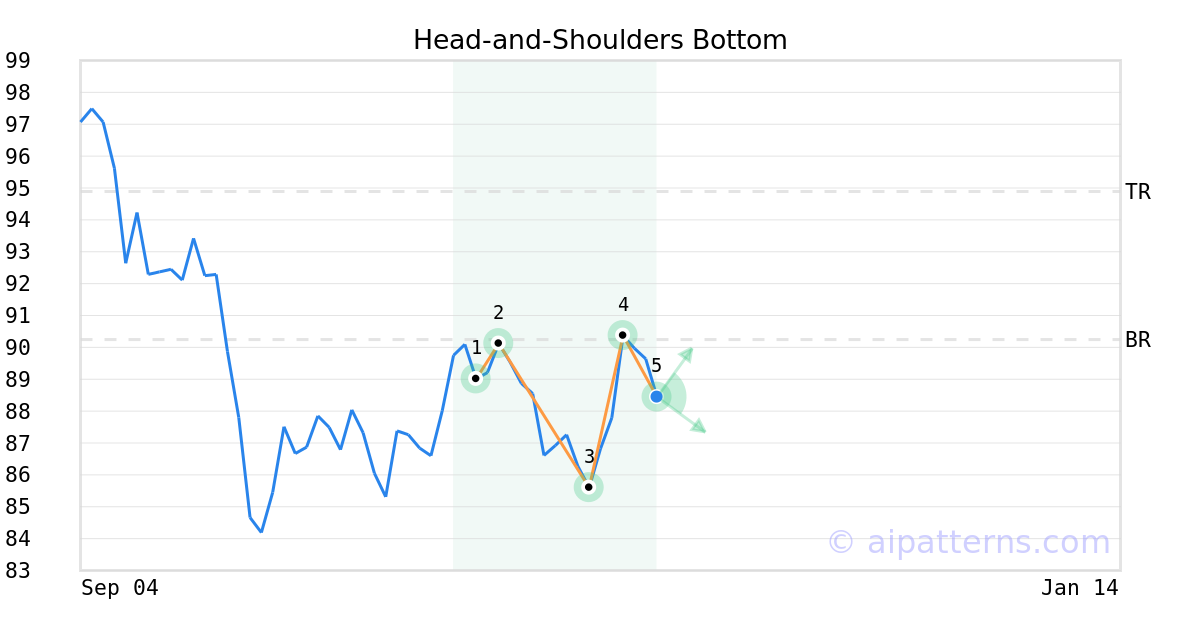
A.I.dvisor detected a bullish Head-and-Shoulders Bottom pattern for LMAT stock. This pattern was detected on November 14, 2025 . The odds of reaching the target price are 6.
The Head-and-Shoulders Bottom pattern is formed when the price of a security creates a center trough (the inverted head, labeled 3) and the left and right inverted shoulders (1, 5). After reaching the lowest low (the Head, 3) the next low is shallower and the trend reverses course to the upside.
Consider buying a security or a call option at the low once the pattern is confirmed, which is known as the breakout point. The pattern is confirmed when the price breaks above the Neckline (2,4).
LMAT's Stochastic Oscillator is remaining in oversold zone for 3 days
The price of this ticker is presumed to bounce back soon, since the longer the ticker stays in the oversold zone, the more promptly an uptrend is expected.

Technical Analysis (Indicators)
Bullish Trend Analysis
Following a 3-day Advance, the price is estimated to grow further. Considering data from situations where LMAT advanced for three days, in of 334 cases, the price rose further within the following month. The odds of a continued upward trend are .
The Aroon Indicator entered an Uptrend today. In of 270 cases where LMAT Aroon's Indicator entered an Uptrend, the price rose further within the following month. The odds of a continued Uptrend are .
Bearish Trend Analysis
The Momentum Indicator moved below the 0 level on November 24, 2025. You may want to consider selling the stock, shorting the stock, or exploring put options on LMAT as a result. In of 94 cases where the Momentum Indicator fell below 0, the stock fell further within the subsequent month. The odds of a continued downward trend are .
The Moving Average Convergence Divergence Histogram (MACD) for LMAT turned negative on November 18, 2025. This could be a sign that the stock is set to turn lower in the coming weeks. Traders may want to sell the stock or buy put options. Tickeron's A.I.dvisor looked at 49 similar instances when the indicator turned negative. In of the 49 cases the stock turned lower in the days that followed. This puts the odds of success at .
LMAT moved below its 50-day moving average on November 14, 2025 date and that indicates a change from an upward trend to a downward trend.
Following a 3-day decline, the stock is projected to fall further. Considering past instances where LMAT declined for three days, the price rose further in of 62 cases within the following month. The odds of a continued downward trend are .
Fundamental Analysis (Ratings)
The Tickeron Profit vs. Risk Rating rating for this company is (best 1 - 100 worst), indicating low risk on high returns. The average Profit vs. Risk Rating rating for the industry is 92, placing this stock better than average.
The Tickeron Valuation Rating of (best 1 - 100 worst) indicates that the company is fair valued in the industry. This rating compares market capitalization estimated by our proprietary formula with the current market capitalization. This rating is based on the following metrics, as compared to industry averages: P/B Ratio (4.965) is normal, around the industry mean (9.214). P/E Ratio (35.754) is within average values for comparable stocks, (165.744). Projected Growth (PEG Ratio) (1.796) is also within normal values, averaging (2.567). Dividend Yield (0.010) settles around the average of (0.016) among similar stocks. P/S Ratio (7.893) is also within normal values, averaging (110.859).
The Tickeron SMR rating for this company is (best 1 - 100 worst), indicating strong sales and a profitable business model. SMR (Sales, Margin, Return on Equity) rating is based on comparative analysis of weighted Sales, Income Margin and Return on Equity values compared against S&P 500 index constituents. The weighted SMR value is a proprietary formula developed by Tickeron and represents an overall profitability measure for a stock.
The Tickeron Price Growth Rating for this company is (best 1 - 100 worst), indicating fairly steady price growth. LMAT’s price grows at a lower rate over the last 12 months as compared to S&P 500 index constituents.
The Tickeron PE Growth Rating for this company is (best 1 - 100 worst), pointing to worse than average earnings growth. The PE Growth rating is based on a comparative analysis of stock PE ratio increase over the last 12 months compared against S&P 500 index constituents.
Advertisement
General Information
a manufacturer of vascular devices for vascular surgeons
Industry PharmaceuticalsOther