LRC.X Crypto Tickeron detected bearish Crypto Pattern: Triangle Symmetrical Bottom LRC.X on October 29, 2025, netting in a 16.70% gain over 3 weeks


at Tickeron.com


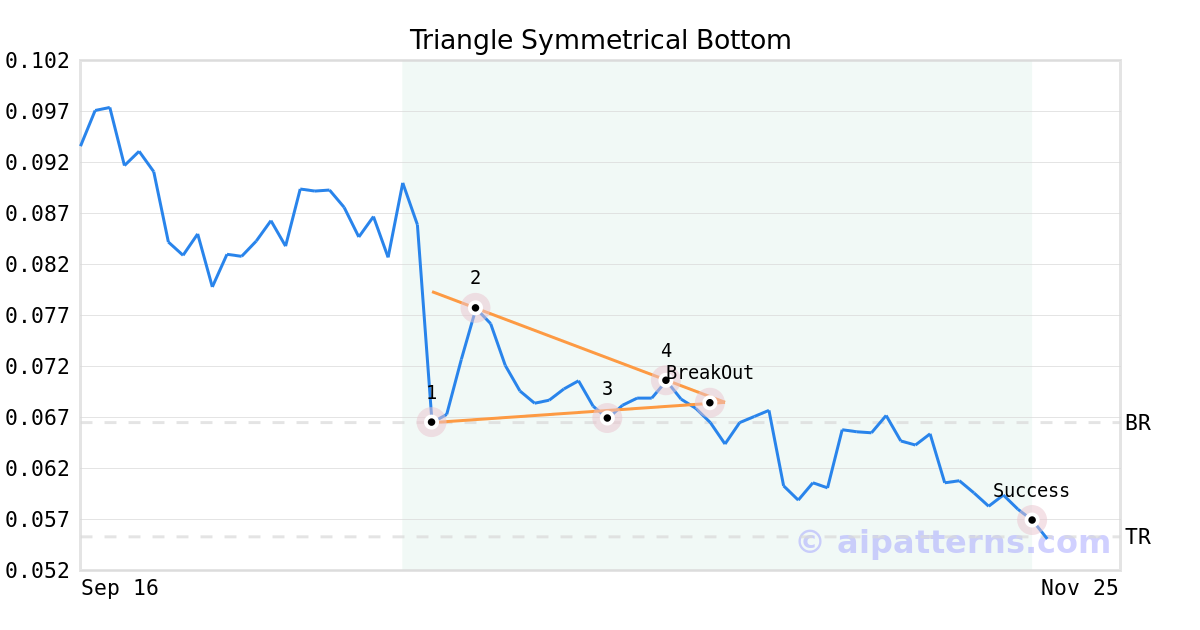
On October 29, 2025, A.I.dvisor detected a Triangle Symmetrical Bottom Pattern (Bearish) for Loopring cryptocurrency (LRC.X, $0.068356). On October 29, 2025, A.I.dvisor confirmed the Bearish pattern, setting a target price of the stock. On November 20, 2025, the stock hit the target price of $0.055300 – resulting in a +1 gain for traders who shorted the stock on the pattern detection date.
LRC.X sees MACD Histogram just turned negative
LRC.X saw its Moving Average Convergence Divergence Histogram (MACD) turn negative on November 17, 2025. This is a bearish signal that suggests the stock could decline going forward. Tickeron's A.I.dvisor looked at 61 instances where the indicator turned negative. In of the 61 cases the stock moved lower in the days that followed. This puts the odds of a downward move at .

Technical Analysis (Indicators)
Bearish Trend Analysis
The Momentum Indicator moved below the 0 level on November 16, 2025. You may want to consider selling the stock, shorting the stock, or exploring put options on LRC.X as a result. In of 124 cases where the Momentum Indicator fell below 0, the stock fell further within the subsequent month. The odds of a continued downward trend are .
Following a 3-day decline, the stock is projected to fall further. Considering past instances where LRC.X declined for three days, the price rose further in of 62 cases within the following month. The odds of a continued downward trend are .
The Aroon Indicator for LRC.X entered a downward trend on November 22, 2025. This could indicate a strong downward move is ahead for the stock. Traders may want to consider selling the stock or buying put options.
Bullish Trend Analysis
The RSI Indicator points to a transition from a downward trend to an upward trend -- in cases where LRC.X's RSI Oscillator exited the oversold zone, of 43 resulted in an increase in price. Tickeron's analysis proposes that the odds of a continued upward trend are .
The Stochastic Oscillator shows that the ticker has stayed in the oversold zone for 10 days. The price of this ticker is presumed to bounce back soon, since the longer the ticker stays in the oversold zone, the more promptly an upward trend is expected.
Following a 3-day Advance, the price is estimated to grow further. Considering data from situations where LRC.X advanced for three days, in of 429 cases, the price rose further within the following month. The odds of a continued upward trend are .
LRC.X may jump back above the lower band and head toward the middle band. Traders may consider buying the stock or exploring call options.