LVS Stock Tickeron detected bullish Stock Pattern: Broadening Top LVS on October 23, 2025, netting in a 16.71% gain over 2 weeks


at Tickeron.com


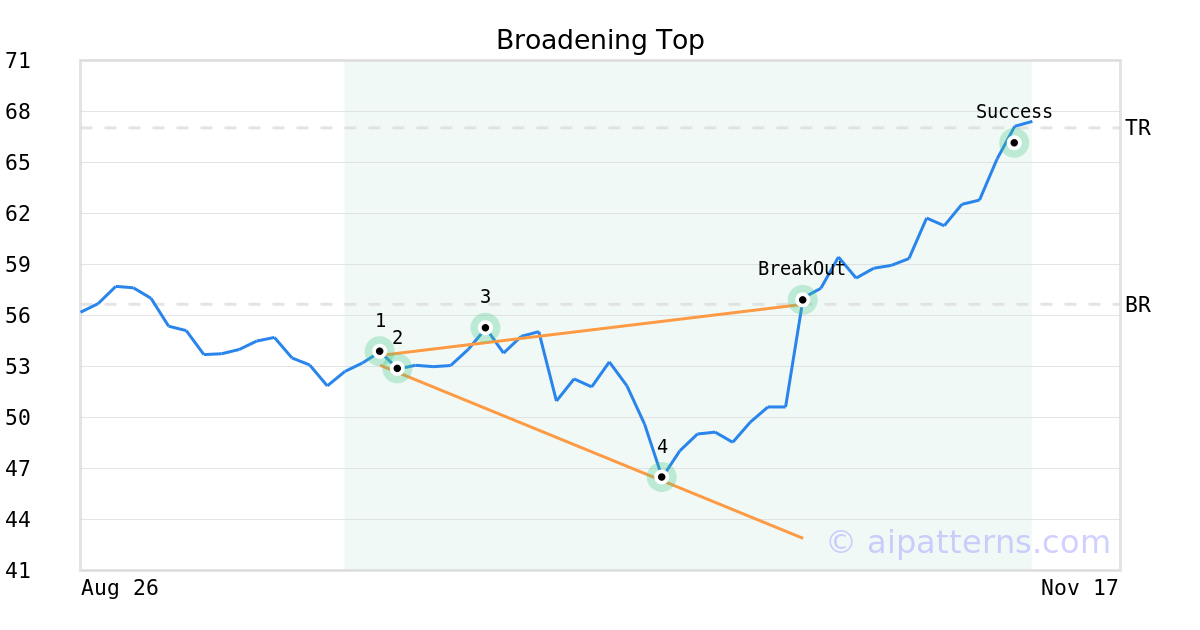
On October 23, 2025, A.I.dvisor detected a Broadening Top Pattern (Bullish) for Las Vegas Sands Corp (LVS, $56.66). On October 23, 2025, A.I.dvisor confirmed the Bullish pattern, setting a target price of $67.04. 18 days later, on November 10, 2025, LVS reached the target price resulting in a +1 for traders who took a long position in the stock.
Momentum Indicator for LVS turns positive, indicating new upward trend
LVS saw its Momentum Indicator move above the 0 level on November 25, 2025. This is an indication that the stock could be shifting in to a new upward move. Traders may want to consider buying the stock or buying call options. Tickeron's A.I.dvisor looked at 86 similar instances where the indicator turned positive. In of the 86 cases, the stock moved higher in the following days. The odds of a move higher are at .

Technical Analysis (Indicators)
Bullish Trend Analysis
The Moving Average Convergence Divergence (MACD) for LVS just turned positive on December 01, 2025. Looking at past instances where LVS's MACD turned positive, the stock continued to rise in of 50 cases over the following month. The odds of a continued upward trend are .
The 10-day moving average for LVS crossed bullishly above the 50-day moving average on October 29, 2025. This indicates that the trend has shifted higher and could be considered a buy signal. In of 14 past instances when the 10-day crossed above the 50-day, the stock continued to move higher over the following month. The odds of a continued upward trend are .
Following a 3-day Advance, the price is estimated to grow further. Considering data from situations where LVS advanced for three days, in of 301 cases, the price rose further within the following month. The odds of a continued upward trend are .
The Aroon Indicator entered an Uptrend today. In of 217 cases where LVS Aroon's Indicator entered an Uptrend, the price rose further within the following month. The odds of a continued Uptrend are .
Bearish Trend Analysis
The RSI Indicator demonstrates that the ticker has stayed in the overbought zone for 4 days. The longer the ticker stays in the overbought zone, the sooner a price pull-back is expected.
The Stochastic Oscillator demonstrated that the ticker has stayed in the overbought zone for 3 days. The longer the ticker stays in the overbought zone, the sooner a price pull-back is expected.
Following a 3-day decline, the stock is projected to fall further. Considering past instances where LVS declined for three days, the price rose further in of 62 cases within the following month. The odds of a continued downward trend are .
Fundamental Analysis (Ratings)
The Tickeron Price Growth Rating for this company is (best 1 - 100 worst), indicating outstanding price growth. LVS’s price grows at a higher rate over the last 12 months as compared to S&P 500 index constituents.
The Tickeron SMR rating for this company is (best 1 - 100 worst), indicating very strong sales and a profitable business model. SMR (Sales, Margin, Return on Equity) rating is based on comparative analysis of weighted Sales, Income Margin and Return on Equity values compared against S&P 500 index constituents. The weighted SMR value is a proprietary formula developed by Tickeron and represents an overall profitability measure for a stock.
The Tickeron PE Growth Rating for this company is (best 1 - 100 worst), pointing to outstanding earnings growth. The PE Growth rating is based on a comparative analysis of stock PE ratio increase over the last 12 months compared against S&P 500 index constituents.
The Tickeron Seasonality Score of (best 1 - 100 worst) indicates that the company is fair valued in the industry. The Tickeron Seasonality score describes the variance of predictable price changes around the same period every calendar year. These changes can be tied to a specific month, quarter, holiday or vacation period, as well as a meteorological or growing season.
The Tickeron Profit vs. Risk Rating rating for this company is (best 1 - 100 worst), indicating well-balanced risk and returns. The average Profit vs. Risk Rating rating for the industry is 82, placing this stock slightly better than average.
The Tickeron Valuation Rating of (best 1 - 100 worst) indicates that the company is fair valued in the industry. This rating compares market capitalization estimated by our proprietary formula with the current market capitalization. This rating is based on the following metrics, as compared to industry averages: LVS's P/B Ratio (29.499) is very high in comparison to the industry average of (6.075). P/E Ratio (30.860) is within average values for comparable stocks, (506.090). Projected Growth (PEG Ratio) (0.935) is also within normal values, averaging (1.815). Dividend Yield (0.015) settles around the average of (0.029) among similar stocks. LVS's P/S Ratio (3.932) is slightly higher than the industry average of (1.710).
Advertisement
General Information
an operator of casino gaming operations, resort hotel facilities and riverboat casinos
Industry HotelsResortsCruiselines