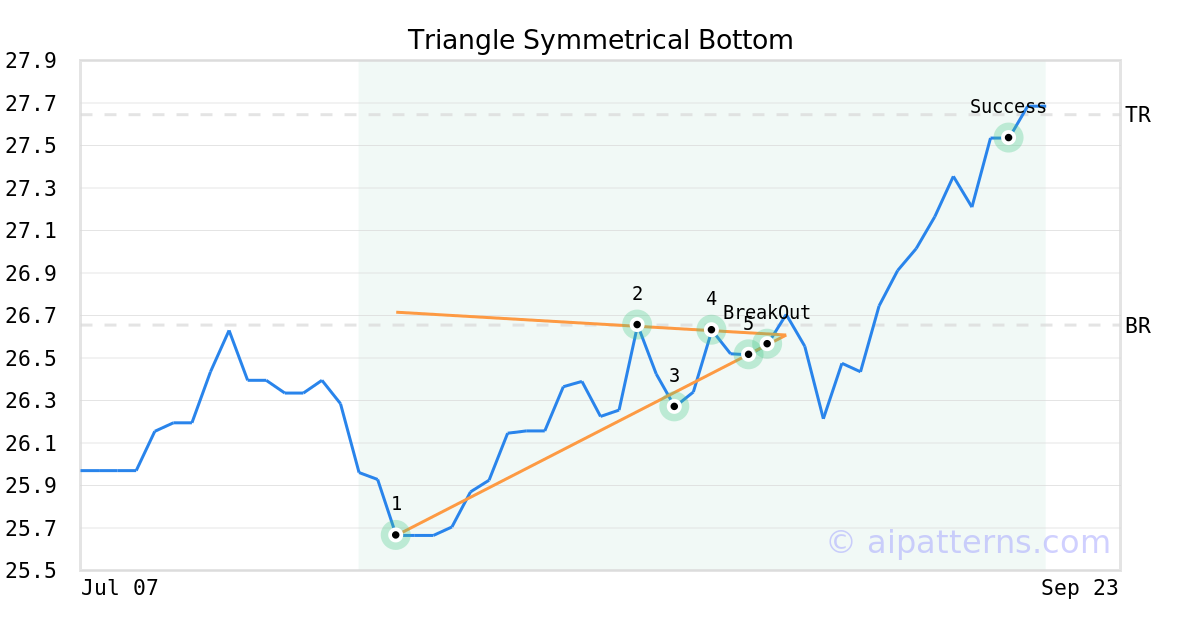
MEMS Stock Tickeron detected bullish ETF Pattern: Triangle Symmetrical Bottom MEMS on August 27, 2025, netting in a 3.85% gain over 3 weeks


at Tickeron.com


Momentum Indicator for MEMS turns positive, indicating new upward trend
MEMS saw its Momentum Indicator move above the 0 level on October 23, 2025. This is an indication that the stock could be shifting in to a new upward move. Traders may want to consider buying the stock or buying call options. Tickeron's A.I.dvisor looked at 27 similar instances where the indicator turned positive. In of the 27 cases, the stock moved higher in the following days. The odds of a move higher are at .

Technical Analysis (Indicators)
Bullish Trend Analysis
The RSI Indicator points to a transition from a downward trend to an upward trend -- in cases where MEMS's RSI Indicator exited the oversold zone, of 8 resulted in an increase in price. Tickeron's analysis proposes that the odds of a continued upward trend are .
The Moving Average Convergence Divergence (MACD) for MEMS just turned positive on October 21, 2025. Looking at past instances where MEMS's MACD turned positive, the stock continued to rise in of 17 cases over the following month. The odds of a continued upward trend are .
MEMS moved above its 50-day moving average on October 20, 2025 date and that indicates a change from a downward trend to an upward trend.
Following a 3-day Advance, the price is estimated to grow further. Considering data from situations where MEMS advanced for three days, in of 86 cases, the price rose further within the following month. The odds of a continued upward trend are .
MEMS may jump back above the lower band and head toward the middle band. Traders may consider buying the stock or exploring call options.
Bearish Trend Analysis
The Stochastic Oscillator demonstrated that the ticker has stayed in the overbought zone for 3 days. The longer the ticker stays in the overbought zone, the sooner a price pull-back is expected.
The 10-day moving average for MEMS crossed bearishly below the 50-day moving average on October 13, 2025. This indicates that the trend has shifted lower and could be considered a sell signal. In of 8 past instances when the 10-day crossed below the 50-day, the stock continued to move higher over the following month. The odds of a continued downward trend are .
Following a 3-day decline, the stock is projected to fall further. Considering past instances where MEMS declined for three days, the price rose further in of 62 cases within the following month. The odds of a continued downward trend are .
The Aroon Indicator for MEMS entered a downward trend on October 21, 2025. This could indicate a strong downward move is ahead for the stock. Traders may want to consider selling the stock or buying put options.


Advertisement
General Information
Category DiversifiedEmergingMkts