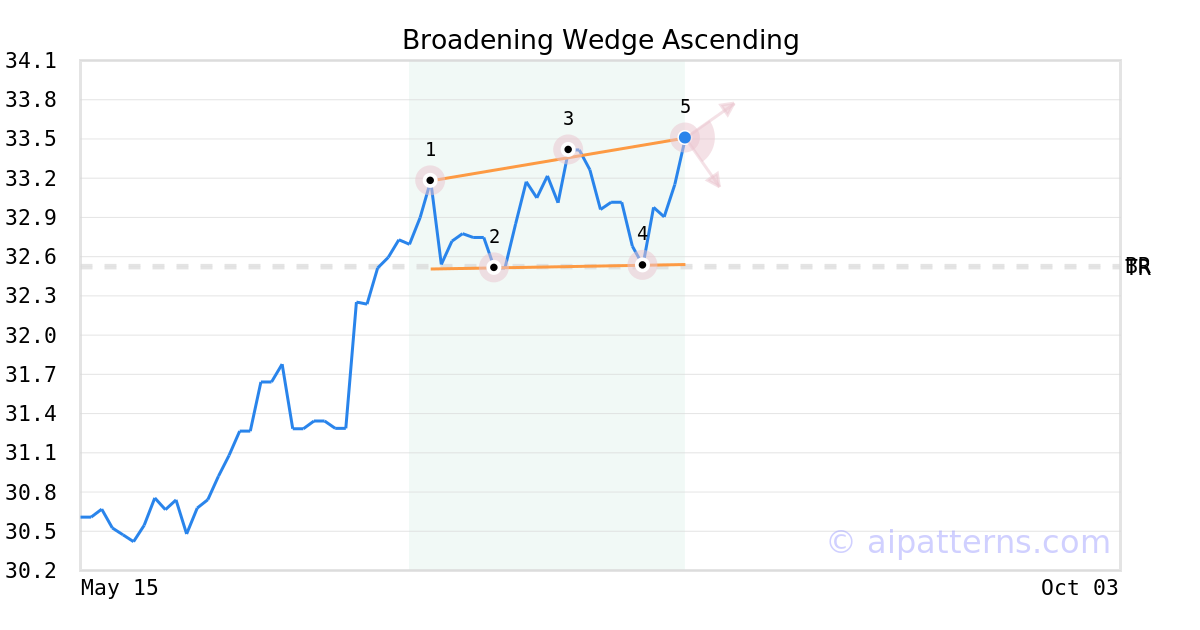
MEMX Stock Tickeron detected bearish ETF Pattern: Broadening Wedge Ascending on August 07, 2025


at Tickeron.com


MEMX in -1.84% downward trend, declining for three consecutive days on September 02, 2025
Moving lower for three straight days is viewed as a bearish sign. Keep an eye on this stock for future declines. Considering data from situations where MEMX declined for three days, in of 134 cases, the price declined further within the following month. The odds of a continued downward trend are .

Technical Analysis (Indicators)
Bearish Trend Analysis
The Moving Average Convergence Divergence Histogram (MACD) for MEMX turned negative on August 19, 2025. This could be a sign that the stock is set to turn lower in the coming weeks. Traders may want to sell the stock or buy put options. Tickeron's A.I.dvisor looked at 27 similar instances when the indicator turned negative. In of the 27 cases the stock turned lower in the days that followed. This puts the odds of success at .
Bullish Trend Analysis
The Stochastic Oscillator suggests the stock price trend may be in a reversal from a downward trend to an upward trend. of 30 cases where MEMX's Stochastic Oscillator exited the oversold zone resulted in an increase in price. Tickeron's analysis proposes that the odds of a continued upward trend are .
The Momentum Indicator moved above the 0 level on September 04, 2025. You may want to consider a long position or call options on MEMX as a result. In of 38 past instances where the momentum indicator moved above 0, the stock continued to climb. The odds of a continued upward trend are .
MEMX moved above its 50-day moving average on September 04, 2025 date and that indicates a change from a downward trend to an upward trend.
Following a 3-day Advance, the price is estimated to grow further. Considering data from situations where MEMX advanced for three days, in of 182 cases, the price rose further within the following month. The odds of a continued upward trend are .
MEMX may jump back above the lower band and head toward the middle band. Traders may consider buying the stock or exploring call options.
The Aroon Indicator entered an Uptrend today. In of 161 cases where MEMX Aroon's Indicator entered an Uptrend, the price rose further within the following month. The odds of a continued Uptrend are .


Advertisement
General Information
Category DiversifiedEmergingMkts