MLPA Stock Tickeron detected bullish ETF Pattern: Broadening Wedge Descending MLPA on November 13, 2025, netting in a 3.01% gain over 1 month


at Tickeron.com


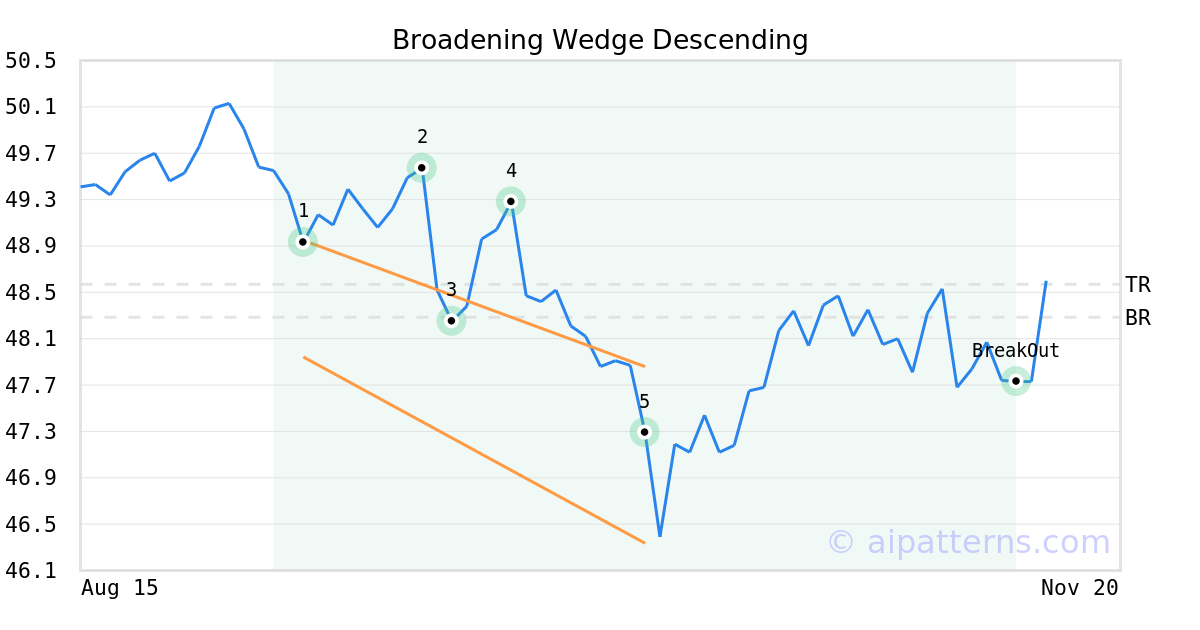
On October 09, 2025, A.I.dvisor detected a Broadening Wedge Descending Pattern (Bullish) for Global X MLP ETF (MLPA, $46.34). On November 13, 2025, A.I.dvisor confirmed the Bullish pattern, setting a target price of $48.57. On November 13, 2025, MLPA reached the target price resulting in a for traders who took a long position in the stock.
MLPA in upward trend: 10-day moving average crossed above 50-day moving average on November 12, 2025
The 10-day moving average for MLPA crossed bullishly above the 50-day moving average on November 12, 2025. This indicates that the trend has shifted higher and could be considered a buy signal. In of 20 past instances when the 10-day crossed above the 50-day, the stock continued to move higher over the following month. The odds of a continued upward trend are .

Technical Analysis (Indicators)
Bullish Trend Analysis
MLPA moved above its 50-day moving average on November 06, 2025 date and that indicates a change from a downward trend to an upward trend.
Following a 3-day Advance, the price is estimated to grow further. Considering data from situations where MLPA advanced for three days, in of 383 cases, the price rose further within the following month. The odds of a continued upward trend are .
The Aroon Indicator entered an Uptrend today. In of 339 cases where MLPA Aroon's Indicator entered an Uptrend, the price rose further within the following month. The odds of a continued Uptrend are .
Bearish Trend Analysis
The RSI Indicator has been in the overbought zone for 1 day. Expect a price pull-back in the near future.
The Stochastic Oscillator has been in the overbought zone for 1 day. Expect a price pull-back in the near future.
Following a 3-day decline, the stock is projected to fall further. Considering past instances where MLPA declined for three days, the price rose further in of 62 cases within the following month. The odds of a continued downward trend are .
MLPA broke above its upper Bollinger Band on November 28, 2025. This could be a sign that the stock is set to drop as the stock moves back below the upper band and toward the middle band. You may want to consider selling the stock or exploring put options.
Advertisement
General Information
Category Energy