MMM Stock Tickeron detected bullish Stock Pattern: Cup-and-Handle on November 14, 2025


at Tickeron.com


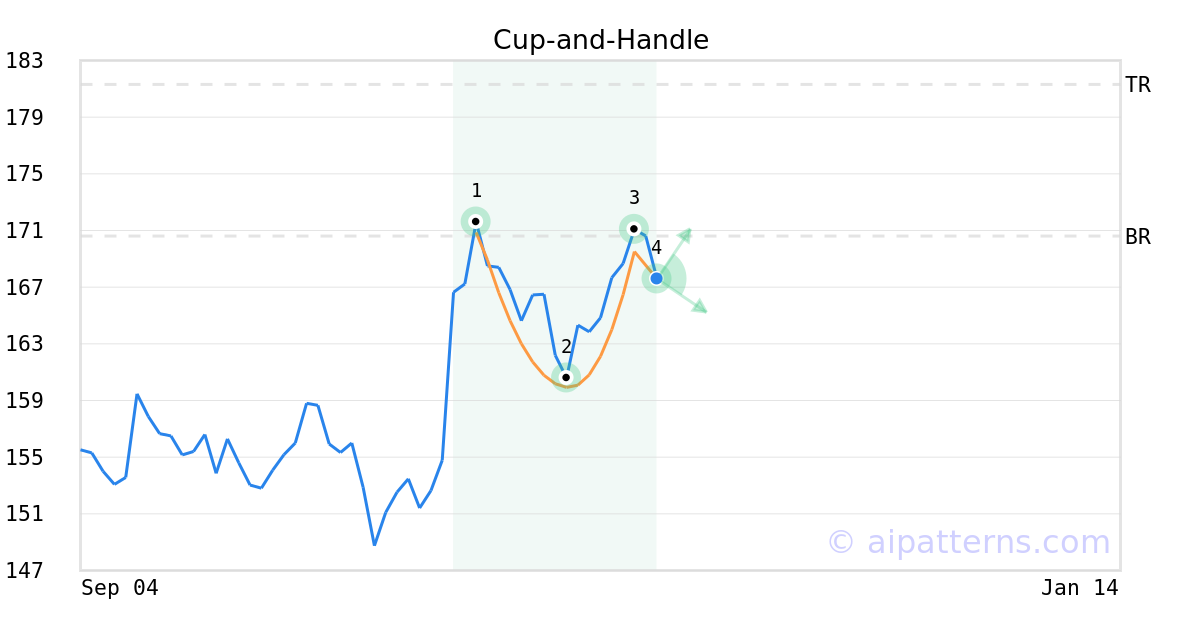
A.I.dvisor detected a bullish Cup-and-Handle pattern for MMM stock. This pattern was detected on November 14, 2025 . The odds of reaching the target price are 6.
The Cup-and-Handle (sometimes called Cup-and-Holder) pattern is formed when the price of a security initially declines and then rises to form a “U”-like rounded shape (1, 2, 3, also known as the Cup). Once it forms the right lip, it is characterized by short, relatively straight price decline (from 3 to 4) forming the handle.
Consider buying a security or call option at the upward breakout price/entry point. The confirmation move is when the security moves past the breakout price above the right cup lip.
Momentum Indicator for MMM turns positive, indicating new upward trend
MMM saw its Momentum Indicator move above the 0 level on November 11, 2025. This is an indication that the stock could be shifting in to a new upward move. Traders may want to consider buying the stock or buying call options. Tickeron's A.I.dvisor looked at 86 similar instances where the indicator turned positive. In of the 86 cases, the stock moved higher in the following days. The odds of a move higher are at .

Technical Analysis (Indicators)
Bullish Trend Analysis
The Moving Average Convergence Divergence (MACD) for MMM just turned positive on November 25, 2025. Looking at past instances where MMM's MACD turned positive, the stock continued to rise in of 48 cases over the following month. The odds of a continued upward trend are .
Following a 3-day Advance, the price is estimated to grow further. Considering data from situations where MMM advanced for three days, in of 307 cases, the price rose further within the following month. The odds of a continued upward trend are .
Bearish Trend Analysis
The Stochastic Oscillator demonstrated that the ticker has stayed in the overbought zone for 3 days. The longer the ticker stays in the overbought zone, the sooner a price pull-back is expected.
Following a 3-day decline, the stock is projected to fall further. Considering past instances where MMM declined for three days, the price rose further in of 62 cases within the following month. The odds of a continued downward trend are .
Fundamental Analysis (Ratings)
The Tickeron PE Growth Rating for this company is (best 1 - 100 worst), pointing to outstanding earnings growth. The PE Growth rating is based on a comparative analysis of stock PE ratio increase over the last 12 months compared against S&P 500 index constituents.
The Tickeron SMR rating for this company is (best 1 - 100 worst), indicating very strong sales and a profitable business model. SMR (Sales, Margin, Return on Equity) rating is based on comparative analysis of weighted Sales, Income Margin and Return on Equity values compared against S&P 500 index constituents. The weighted SMR value is a proprietary formula developed by Tickeron and represents an overall profitability measure for a stock.
The Tickeron Price Growth Rating for this company is (best 1 - 100 worst), indicating outstanding price growth. MMM’s price grows at a higher rate over the last 12 months as compared to S&P 500 index constituents.
The Tickeron Seasonality Score of (best 1 - 100 worst) indicates that the company is fair valued in the industry. The Tickeron Seasonality score describes the variance of predictable price changes around the same period every calendar year. These changes can be tied to a specific month, quarter, holiday or vacation period, as well as a meteorological or growing season.
The Tickeron Profit vs. Risk Rating rating for this company is (best 1 - 100 worst), indicating well-balanced risk and returns. The average Profit vs. Risk Rating rating for the industry is 68, placing this stock slightly better than average.
The Tickeron Valuation Rating of (best 1 - 100 worst) indicates that the company is significantly overvalued in the industry. This rating compares market capitalization estimated by our proprietary formula with the current market capitalization. This rating is based on the following metrics, as compared to industry averages: P/B Ratio (19.569) is normal, around the industry mean (9.152). P/E Ratio (27.190) is within average values for comparable stocks, (31.146). MMM's Projected Growth (PEG Ratio) (3.408) is slightly higher than the industry average of (1.696). Dividend Yield (0.017) settles around the average of (0.031) among similar stocks. P/S Ratio (3.730) is also within normal values, averaging (3.367).
Advertisement
General Information
an industrial conglomerate which manufactures and distributes consumer products such as papers, electronic gadgets and medical supplies
Industry IndustrialConglomerates