MPA Stock Tickeron detected bullish ETF Pattern: Cup-and-Handle on November 14, 2025


at Tickeron.com


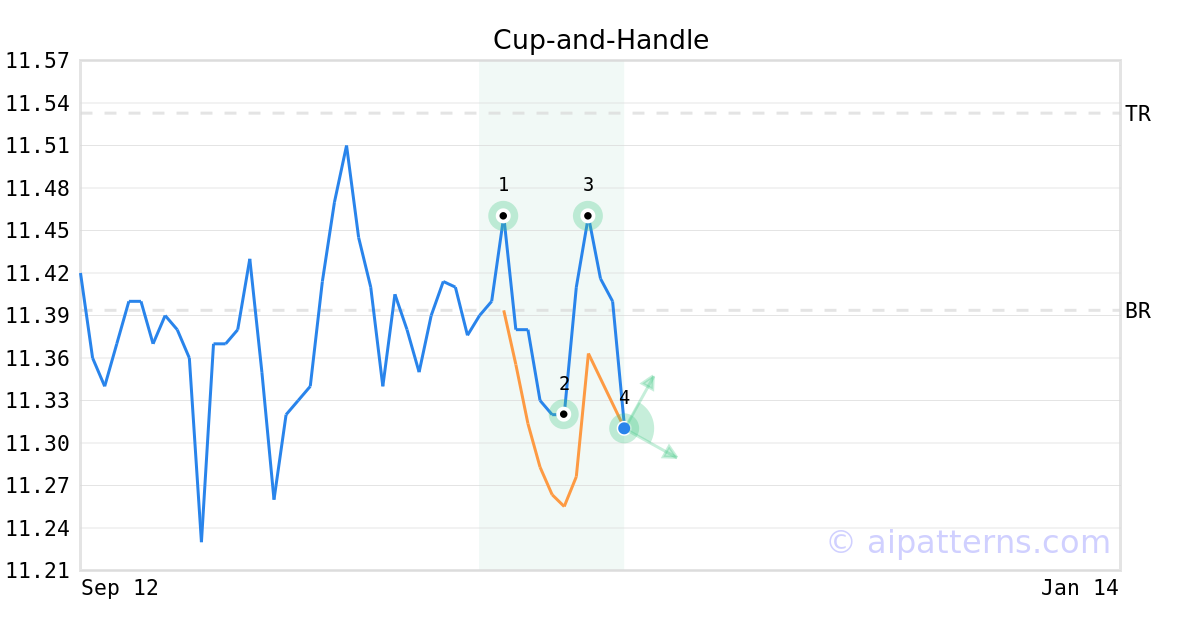
A.I.dvisor detected a bullish Cup-and-Handle pattern for MPA stock. This pattern was detected on November 14, 2025 . The odds of reaching the target price are 6.
The Cup-and-Handle (sometimes called Cup-and-Holder) pattern is formed when the price of a security initially declines and then rises to form a “U”-like rounded shape (1, 2, 3, also known as the Cup). Once it forms the right lip, it is characterized by short, relatively straight price decline (from 3 to 4) forming the handle.
Consider buying a security or call option at the upward breakout price/entry point. The confirmation move is when the security moves past the breakout price above the right cup lip.
MPA in +0.45% Uptrend, advancing for three consecutive days on November 26, 2025
Moving higher for three straight days is viewed as a bullish sign. Keep an eye on this stock for future growth. Considering data from situations where MPA advanced for three days, in of 300 cases, the price rose further within the following month. The odds of a continued upward trend are .

Technical Analysis (Indicators)
Bullish Trend Analysis
The Stochastic Oscillator suggests the stock price trend may be in a reversal from a downward trend to an upward trend. of 59 cases where MPA's Stochastic Oscillator exited the oversold zone resulted in an increase in price. Tickeron's analysis proposes that the odds of a continued upward trend are .
MPA may jump back above the lower band and head toward the middle band. Traders may consider buying the stock or exploring call options.
Bearish Trend Analysis
The Momentum Indicator moved below the 0 level on November 14, 2025. You may want to consider selling the stock, shorting the stock, or exploring put options on MPA as a result. In of 74 cases where the Momentum Indicator fell below 0, the stock fell further within the subsequent month. The odds of a continued downward trend are .
MPA moved below its 50-day moving average on November 18, 2025 date and that indicates a change from an upward trend to a downward trend.
The 10-day moving average for MPA crossed bearishly below the 50-day moving average on November 24, 2025. This indicates that the trend has shifted lower and could be considered a sell signal. In of 17 past instances when the 10-day crossed below the 50-day, the stock continued to move higher over the following month. The odds of a continued downward trend are .
Following a 3-day decline, the stock is projected to fall further. Considering past instances where MPA declined for three days, the price rose further in of 62 cases within the following month. The odds of a continued downward trend are .
The Aroon Indicator for MPA entered a downward trend on November 26, 2025. This could indicate a strong downward move is ahead for the stock. Traders may want to consider selling the stock or buying put options.
Advertisement
General Information
Category Unknown