MRGR Stock Tickeron detected bearish ETF Pattern: Cup-and-Handle Inverse on September 11, 2024


at Tickeron.com


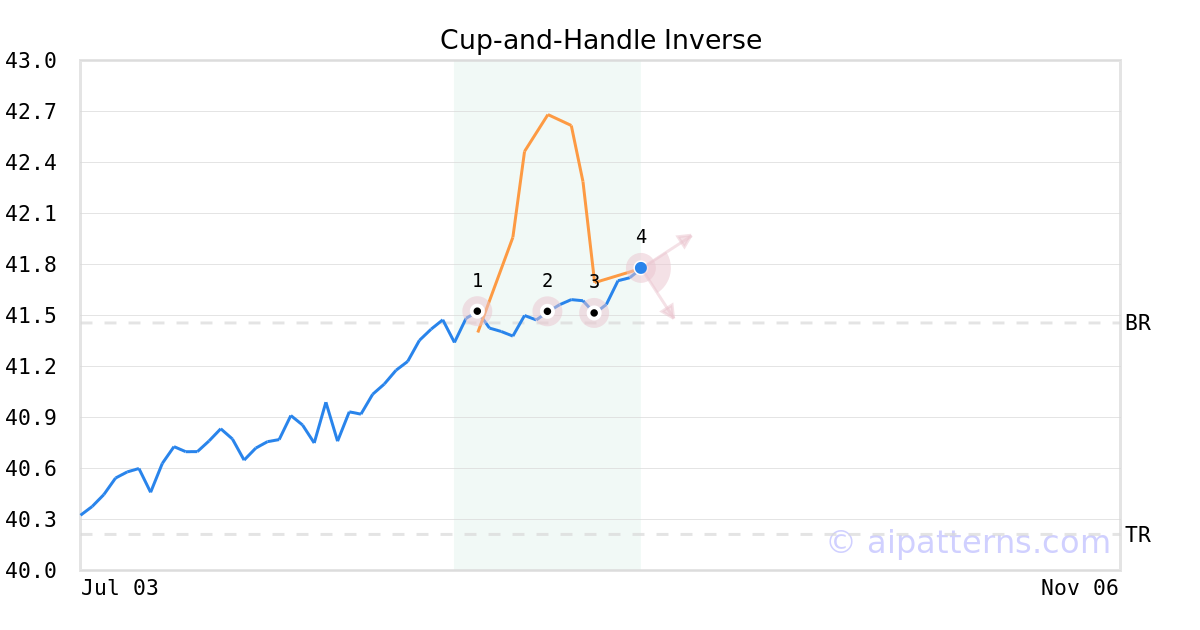
A.I.dvisor detected a bearish Cup-and-Handle Inverse pattern for MRGR stock. This pattern was detected on September 11, 2024 . The odds of reaching the target price are 6.
The Inverted Cup-and-Handle (sometimes called Inverted Cup-and-Holder) pattern forms when prices rise then decline to create an upside-down “U”like shape (1, 2, 3, also known as the Cup), followed by a shorter relatively straight price increase that bounces from the right lip (from 3 to 4, creating the Handle).
Consider selling the security short or buying a put option at the downward breakout level. The confirmation move is the breakout of the price below the right cup lip.
Aroon Indicator for MRGR shows an upward move is likely
MRGR's Aroon Indicator triggered a bullish signal on November 28, 2025. Tickeron's A.I.dvisor detected that the AroonUp green line is above 70 while the AroonDown red line is below 30. When the up indicator moves above 70 and the down indicator remains below 30, it is a sign that the stock could be setting up for a bullish move. Traders may want to buy the stock or look to buy calls options. A.I.dvisor looked at 268 similar instances where the Aroon Indicator showed a similar pattern. In of the 268 cases, the stock moved higher in the days that followed. This puts the odds of a move higher at .

Technical Analysis (Indicators)
Bullish Trend Analysis
The Momentum Indicator moved above the 0 level on October 30, 2025. You may want to consider a long position or call options on MRGR as a result. In of 85 past instances where the momentum indicator moved above 0, the stock continued to climb. The odds of a continued upward trend are .
Following a 3-day Advance, the price is estimated to grow further. Considering data from situations where MRGR advanced for three days, in of 303 cases, the price rose further within the following month. The odds of a continued upward trend are .
Bearish Trend Analysis
The RSI Indicator demonstrates that the ticker has stayed in the overbought zone for 20 days. The longer the ticker stays in the overbought zone, the sooner a price pull-back is expected.
The Stochastic Oscillator has been in the overbought zone for 2 days. Expect a price pull-back in the near future.
The Moving Average Convergence Divergence Histogram (MACD) for MRGR turned negative on November 28, 2025. This could be a sign that the stock is set to turn lower in the coming weeks. Traders may want to sell the stock or buy put options. Tickeron's A.I.dvisor looked at 46 similar instances when the indicator turned negative. In of the 46 cases the stock turned lower in the days that followed. This puts the odds of success at .
Following a 3-day decline, the stock is projected to fall further. Considering past instances where MRGR declined for three days, the price rose further in of 62 cases within the following month. The odds of a continued downward trend are .
MRGR broke above its upper Bollinger Band on November 25, 2025. This could be a sign that the stock is set to drop as the stock moves back below the upper band and toward the middle band. You may want to consider selling the stock or exploring put options.
Advertisement
General Information
Category Trading