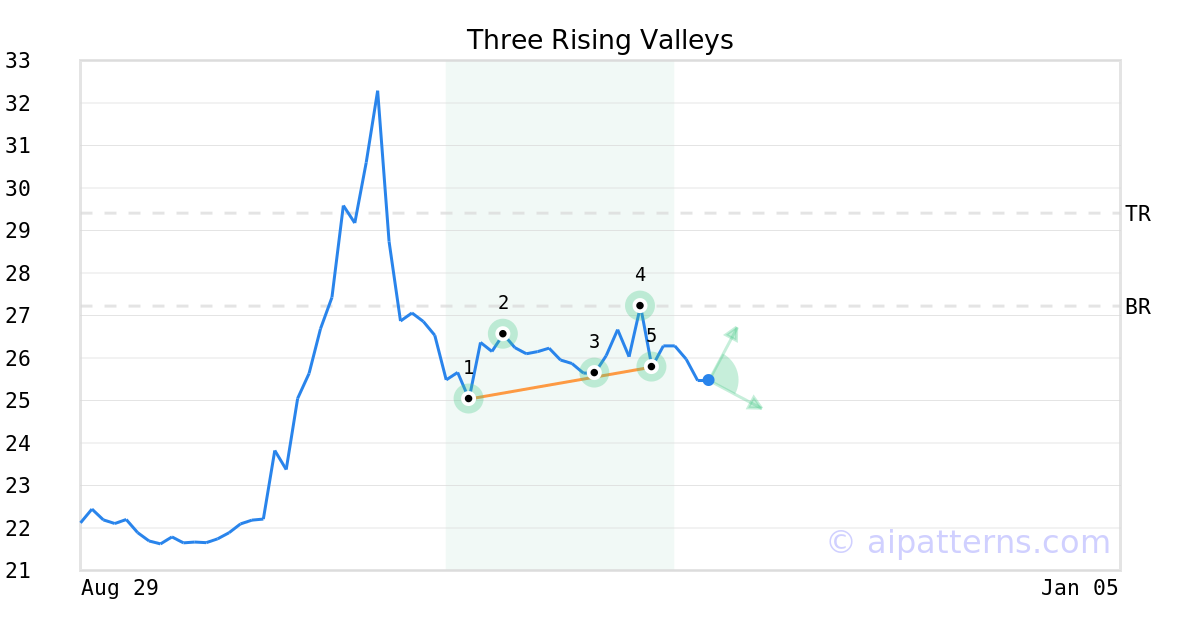
NBCE Stock Tickeron detected bullish ETF Pattern: Three Rising Valleys on November 08, 2024


at Tickeron.com


NBCE's Stochastic Oscillator sits in oversold zone for 4 days
The price of this ticker is presumed to bounce back soon, since the longer the ticker stays in the oversold zone, the more promptly an uptrend is expected.

Technical Analysis (Indicators)
Bullish Trend Analysis
NBCE may jump back above the lower band and head toward the middle band. Traders may consider buying the stock or exploring call options.
The Aroon Indicator entered an Uptrend today. In of 80 cases where NBCE Aroon's Indicator entered an Uptrend, the price rose further within the following month. The odds of a continued Uptrend are .
Bearish Trend Analysis
The 10-day RSI Indicator for NBCE moved out of overbought territory on October 17, 2025. This could be a bearish sign for the stock. Traders may want to consider selling the stock or buying put options. Tickeron's A.I.dvisor looked at 6 similar instances where the indicator moved out of overbought territory. In of the 6 cases, the stock moved lower in the following days. This puts the odds of a move lower at .
The Momentum Indicator moved below the 0 level on October 17, 2025. You may want to consider selling the stock, shorting the stock, or exploring put options on NBCE as a result. In of 22 cases where the Momentum Indicator fell below 0, the stock fell further within the subsequent month. The odds of a continued downward trend are .
The Moving Average Convergence Divergence Histogram (MACD) for NBCE turned negative on October 13, 2025. This could be a sign that the stock is set to turn lower in the coming weeks. Traders may want to sell the stock or buy put options. Tickeron's A.I.dvisor looked at 13 similar instances when the indicator turned negative. In of the 13 cases the stock turned lower in the days that followed. This puts the odds of success at .


Advertisement
General Information
Category PacificAsiaexJapanStk