NFLP Stock Tickeron detected bearish ETF Pattern: Wedge Falling NFLP on October 01, 2025, netting in a 6.85% gain over 4 weeks


at Tickeron.com


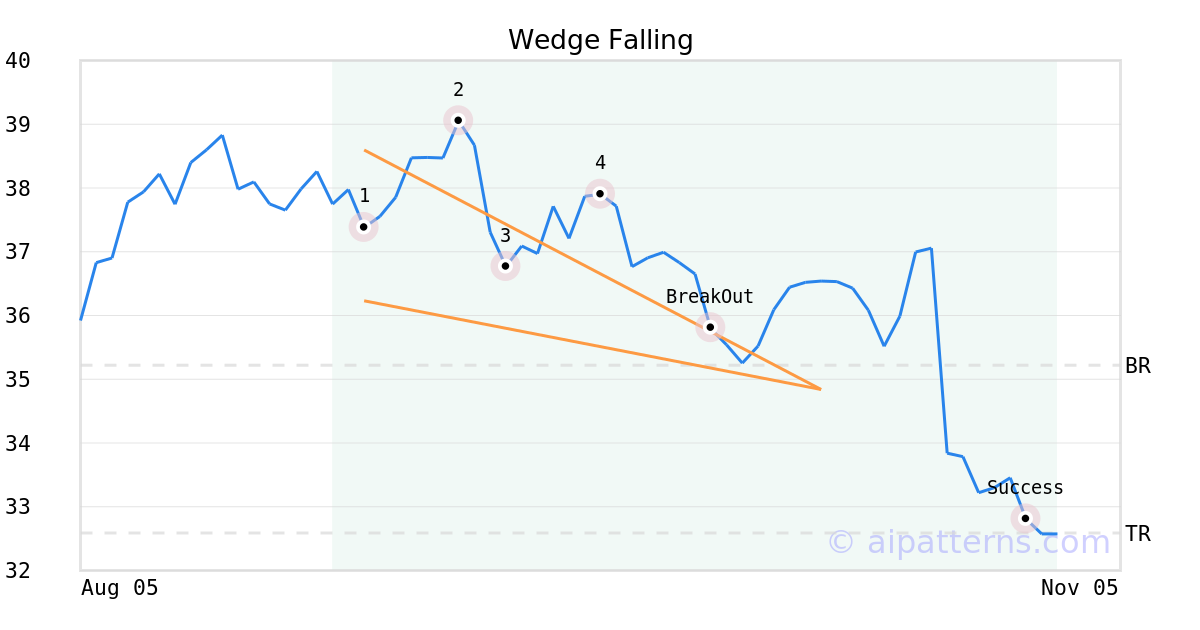
On October 01, 2025, A.I.dvisor detected a Wedge Falling Pattern (Bearish) for Kurv Yield Premium Str Netflix ETF (NFLP, $35.22). On October 01, 2025, A.I.dvisor confirmed the Bearish pattern, setting a target price of the stock. On October 29, 2025, the stock hit the target price of $32.59 – resulting in a gain for traders who shorted the stock on the pattern detection date.
NFLP in downward trend: price expected to drop as it breaks its higher Bollinger Band on November 11, 2025
NFLP broke above its upper Bollinger Band on November 11, 2025. This could be a sign that the stock is set to drop as the stock moves back below the upper band and toward the middle band. You may want to consider selling the stock or exploring put options. The A.I.dvisor looked at 19 similar instances where the stock broke above the upper band. In of the 19 cases the stock fell afterwards. This puts the odds of success at .

Technical Analysis (Indicators)
Bearish Trend Analysis
The Stochastic Oscillator may be shifting from an upward trend to a downward trend. In of 27 cases where NFLP's Stochastic Oscillator exited the overbought zone, the price fell further within the following month. The odds of a continued downward trend are .
NFLP moved below its 50-day moving average on October 22, 2025 date and that indicates a change from an upward trend to a downward trend.
Following a 3-day decline, the stock is projected to fall further. Considering past instances where NFLP declined for three days, the price rose further in of 62 cases within the following month. The odds of a continued downward trend are .
The Aroon Indicator for NFLP entered a downward trend on November 03, 2025. This could indicate a strong downward move is ahead for the stock. Traders may want to consider selling the stock or buying put options.
Bullish Trend Analysis
The RSI Oscillator points to a transition from a downward trend to an upward trend -- in cases where NFLP's RSI Indicator exited the oversold zone, of 7 resulted in an increase in price. Tickeron's analysis proposes that the odds of a continued upward trend are .
The Momentum Indicator moved above the 0 level on November 07, 2025. You may want to consider a long position or call options on NFLP as a result. In of 28 past instances where the momentum indicator moved above 0, the stock continued to climb. The odds of a continued upward trend are .
The Moving Average Convergence Divergence (MACD) for NFLP just turned positive on November 10, 2025. Looking at past instances where NFLP's MACD turned positive, the stock continued to rise in of 18 cases over the following month. The odds of a continued upward trend are .
Following a 3-day Advance, the price is estimated to grow further. Considering data from situations where NFLP advanced for three days, in of 161 cases, the price rose further within the following month. The odds of a continued upward trend are .
Advertisement
General Information
Category Trading