NVDX Stock Tickeron detected bearish ETF Pattern: Broadening Wedge Ascending NVDX on November 06, 2025, netting in a 13.14% gain over 1 week


at Tickeron.com


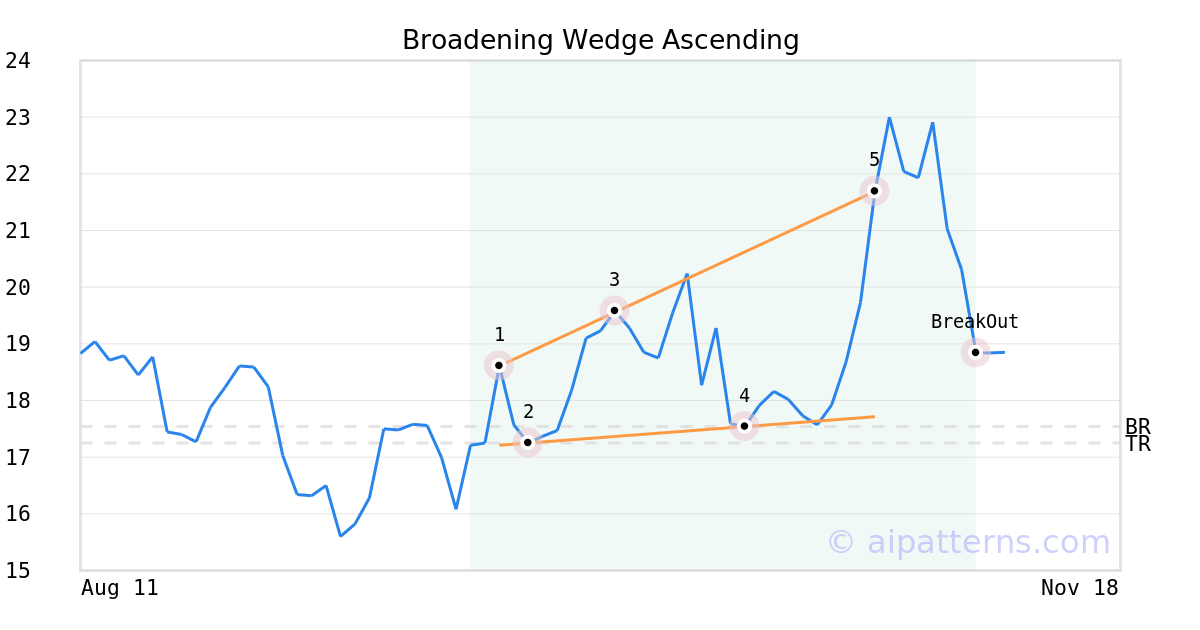
On October 28, 2025, A.I.dvisor detected a Broadening Wedge Ascending Pattern (Bearish) for T-REX 2X Long NVIDIA Daily Target ETF (NVDX, $21.69). 9 days later, on November 06, 2025, A.I.dvisor confirmed the Bearish pattern, setting a target price of the stock. On November 06, 2025, the stock hit the target price of $17.25 – resulting in a +1 gain for traders who shorted the stock on the pattern detection date.
NVDX's RSI Oscillator leaves overbought zone
The 10-day RSI Indicator for NVDX moved out of overbought territory on November 04, 2025. This could be a sign that the stock is shifting from an upward trend to a downward trend. Traders may want to look at selling the stock or buying put options. Tickeron's A.I.dvisor looked at 18 instances where the indicator moved out of the overbought zone. In of the 18 cases the stock moved lower in the days that followed. This puts the odds of a move down at .

Technical Analysis (Indicators)
Bearish Trend Analysis
The Momentum Indicator moved below the 0 level on November 11, 2025. You may want to consider selling the stock, shorting the stock, or exploring put options on NVDX as a result. In of 28 cases where the Momentum Indicator fell below 0, the stock fell further within the subsequent month. The odds of a continued downward trend are .
The Moving Average Convergence Divergence Histogram (MACD) for NVDX turned negative on November 06, 2025. This could be a sign that the stock is set to turn lower in the coming weeks. Traders may want to sell the stock or buy put options. Tickeron's A.I.dvisor looked at 17 similar instances when the indicator turned negative. In of the 17 cases the stock turned lower in the days that followed. This puts the odds of success at .
NVDX moved below its 50-day moving average on November 17, 2025 date and that indicates a change from an upward trend to a downward trend.
The 10-day moving average for NVDX crossed bearishly below the 50-day moving average on November 20, 2025. This indicates that the trend has shifted lower and could be considered a sell signal. In of 4 past instances when the 10-day crossed below the 50-day, the stock continued to move higher over the following month. The odds of a continued downward trend are .
Following a 3-day decline, the stock is projected to fall further. Considering past instances where NVDX declined for three days, the price rose further in of 62 cases within the following month. The odds of a continued downward trend are .
NVDX broke above its upper Bollinger Band on October 28, 2025. This could be a sign that the stock is set to drop as the stock moves back below the upper band and toward the middle band. You may want to consider selling the stock or exploring put options.
Bullish Trend Analysis
The Stochastic Oscillator shows that the ticker has stayed in the oversold zone for 4 days. The price of this ticker is presumed to bounce back soon, since the longer the ticker stays in the oversold zone, the more promptly an upward trend is expected.
Following a +1 3-day Advance, the price is estimated to grow further. Considering data from situations where NVDX advanced for three days, in of 145 cases, the price rose further within the following month. The odds of a continued upward trend are .
The Aroon Indicator entered an Uptrend today. In of 158 cases where NVDX Aroon's Indicator entered an Uptrend, the price rose further within the following month. The odds of a continued Uptrend are .
Advertisement
General Information
Category Trading