OTTW Stock Ottawa Ban (OTTW) is expected to pay dividends on December 17, 2025


at Tickeron.com
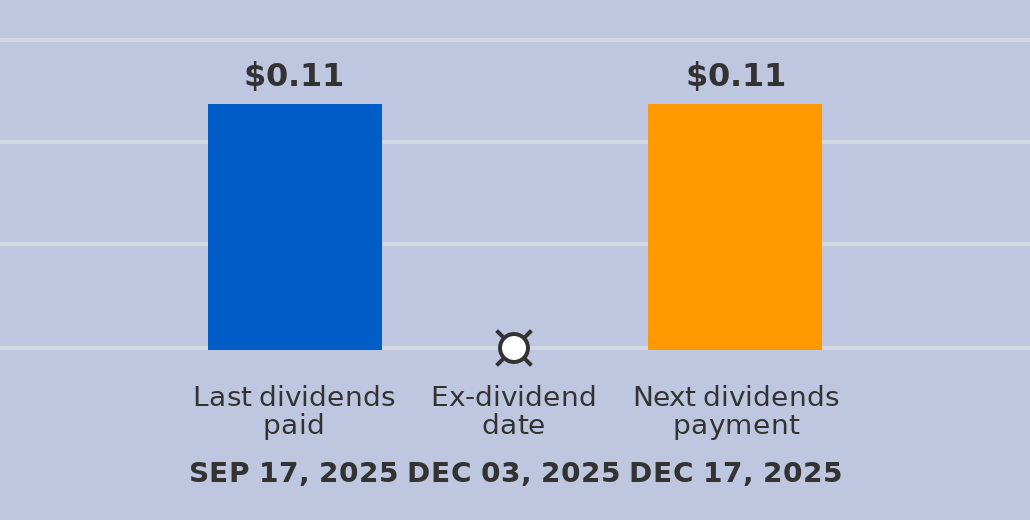
A dividend of $0.11 per share will be paid with a record date of December 17, 2025, and an ex-dividend date of December 03, 2025. The last dividend of $0.11 was paid on September 17, 2025. The ex-dividend date is usually set several business days before the record date. If a stock is purchased on its ex-dividend date or after, the next dividend payment will not be received. Instead, the dividends are repossessed by to the seller. If the stocks are purchased before the ex-dividend date, the buyer will receive the dividends.
OTTW's RSI Indicator remains in oversold zone for 6 days
The price of this ticker is presumed to bounce back soon, since the longer the ticker stays in the oversold zone, the more promptly an uptrend is expected.

Technical Analysis (Indicators)
Bullish Trend Analysis
The Stochastic Oscillator shows that the ticker has stayed in the oversold zone for 21 days. The price of this ticker is presumed to bounce back soon, since the longer the ticker stays in the oversold zone, the more promptly an upward trend is expected.
OTTW may jump back above the lower band and head toward the middle band. Traders may consider buying the stock or exploring call options.
Bearish Trend Analysis
The Momentum Indicator moved below the 0 level on October 27, 2025. You may want to consider selling the stock, shorting the stock, or exploring put options on OTTW as a result. In of 111 cases where the Momentum Indicator fell below 0, the stock fell further within the subsequent month. The odds of a continued downward trend are .
The Moving Average Convergence Divergence Histogram (MACD) for OTTW turned negative on October 27, 2025. This could be a sign that the stock is set to turn lower in the coming weeks. Traders may want to sell the stock or buy put options. Tickeron's A.I.dvisor looked at 56 similar instances when the indicator turned negative. In of the 56 cases the stock turned lower in the days that followed. This puts the odds of success at .
OTTW moved below its 50-day moving average on October 27, 2025 date and that indicates a change from an upward trend to a downward trend.
The 10-day moving average for OTTW crossed bearishly below the 50-day moving average on October 31, 2025. This indicates that the trend has shifted lower and could be considered a sell signal. In of 17 past instances when the 10-day crossed below the 50-day, the stock continued to move higher over the following month. The odds of a continued downward trend are .
The Aroon Indicator for OTTW entered a downward trend on November 28, 2025. This could indicate a strong downward move is ahead for the stock. Traders may want to consider selling the stock or buying put options.
Fundamental Analysis (Ratings)
The Tickeron Profit vs. Risk Rating rating for this company is (best 1 - 100 worst), indicating well-balanced risk and returns. The average Profit vs. Risk Rating rating for the industry is 51, placing this stock slightly better than average.
The Tickeron PE Growth Rating for this company is (best 1 - 100 worst), pointing to consistent earnings growth. The PE Growth rating is based on a comparative analysis of stock PE ratio increase over the last 12 months compared against S&P 500 index constituents.
The Tickeron Price Growth Rating for this company is (best 1 - 100 worst), indicating fairly steady price growth. OTTW’s price grows at a lower rate over the last 12 months as compared to S&P 500 index constituents.
The Tickeron SMR rating for this company is (best 1 - 100 worst), indicating weak sales and an unprofitable business model. SMR (Sales, Margin, Return on Equity) rating is based on comparative analysis of weighted Sales, Income Margin and Return on Equity values compared against S&P 500 index constituents. The weighted SMR value is a proprietary formula developed by Tickeron and represents an overall profitability measure for a stock.
The Tickeron Valuation Rating of (best 1 - 100 worst) indicates that the company is significantly overvalued in the industry. This rating compares market capitalization estimated by our proprietary formula with the current market capitalization. This rating is based on the following metrics, as compared to industry averages: P/B Ratio (0.821) is normal, around the industry mean (1.123). OTTW has a moderately high P/E Ratio (82.278) as compared to the industry average of (18.233). Projected Growth (PEG Ratio) (0.000) is also within normal values, averaging (3.226). Dividend Yield (0.030) settles around the average of (0.036) among similar stocks. P/S Ratio (3.765) is also within normal values, averaging (5.219).
Advertisement
General Information
a savings bank
Industry RegionalBanks