PAVE Stock Tickeron detected bearish ETF Pattern: Broadening Wedge Ascending PAVE on November 17, 2025, netting in a 3.30% gain over 1 month


at Tickeron.com


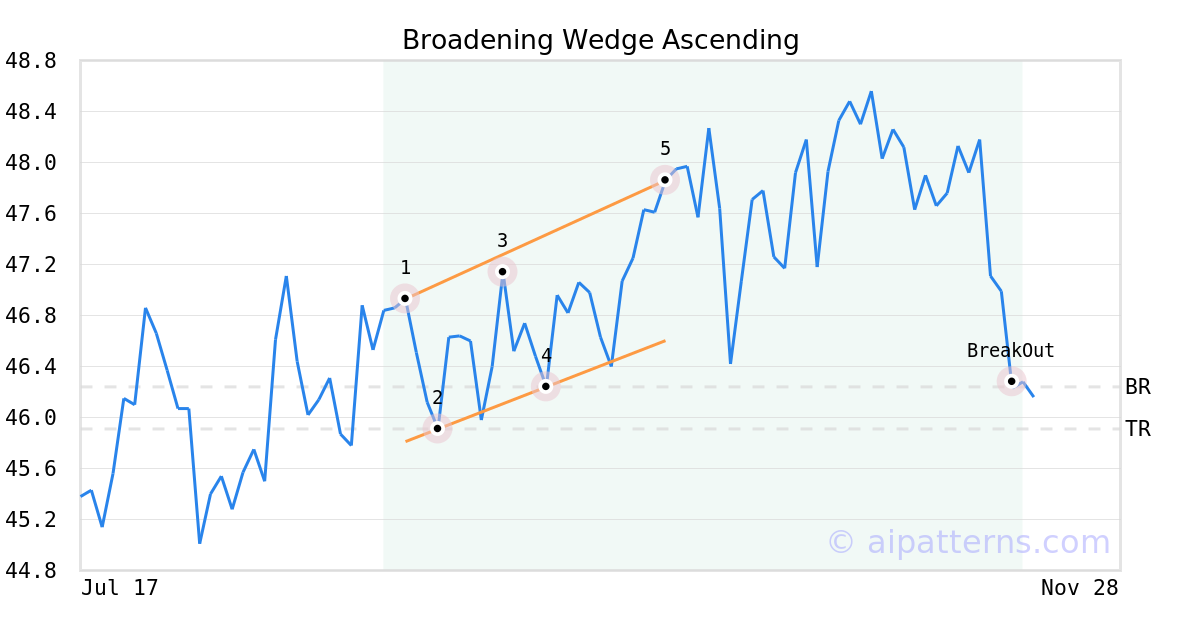
On October 02, 2025, A.I.dvisor detected a Broadening Wedge Ascending Pattern (Bearish) for Global X US Infrastructure Dev ETF (PAVE, $47.86). 46 days later, on November 17, 2025, A.I.dvisor confirmed the Bearish pattern, setting a target price of the stock. On November 17, 2025, the stock hit the target price of $45.91 – resulting in a gain for traders who shorted the stock on the pattern detection date.
PAVE in downward trend: 10-day moving average moved below 50-day moving average on November 18, 2025
The 10-day moving average for PAVE crossed bearishly below the 50-day moving average on November 18, 2025. This indicates that the trend has shifted lower and could be considered a sell signal. In of 15 past instances when the 10-day crossed below the 50-day, the stock continued to move higher over the following month. The odds of a continued downward trend are .

Technical Analysis (Indicators)
Bearish Trend Analysis
The Momentum Indicator moved below the 0 level on November 06, 2025. You may want to consider selling the stock, shorting the stock, or exploring put options on PAVE as a result. In of 86 cases where the Momentum Indicator fell below 0, the stock fell further within the subsequent month. The odds of a continued downward trend are .
The Moving Average Convergence Divergence Histogram (MACD) for PAVE turned negative on November 04, 2025. This could be a sign that the stock is set to turn lower in the coming weeks. Traders may want to sell the stock or buy put options. Tickeron's A.I.dvisor looked at 46 similar instances when the indicator turned negative. In of the 46 cases the stock turned lower in the days that followed. This puts the odds of success at .
PAVE moved below its 50-day moving average on November 13, 2025 date and that indicates a change from an upward trend to a downward trend.
Following a 3-day decline, the stock is projected to fall further. Considering past instances where PAVE declined for three days, the price rose further in of 62 cases within the following month. The odds of a continued downward trend are .
Bullish Trend Analysis
The Stochastic Oscillator demonstrated that the ticker has stayed in the oversold zone for 1 day, which means it's wise to expect a price bounce in the near future.
Following a 3-day Advance, the price is estimated to grow further. Considering data from situations where PAVE advanced for three days, in of 351 cases, the price rose further within the following month. The odds of a continued upward trend are .
PAVE may jump back above the lower band and head toward the middle band. Traders may consider buying the stock or exploring call options.
The Aroon Indicator entered an Uptrend today. In of 362 cases where PAVE Aroon's Indicator entered an Uptrend, the price rose further within the following month. The odds of a continued Uptrend are .
Advertisement
General Information
Category Industrials