MENU
PCBIX
AS OF
Nov 19 closing price
Price
$44.34
Change
-$0.02 (-0.05%)
Net Assets
30.83B
Intraday BUY SELL Signals
PCBIX Stock Tickeron detected bearish Mutual Fund Pattern: Triangle Symmetrical Bottom on June 14, 2024


A.I.dvisor
at Tickeron.com
at Tickeron.com
Buy or Sell
View Daily SignalsLoading...
Triangle Symmetrical Bottom
PCBIX - Principal MidCap Institutional


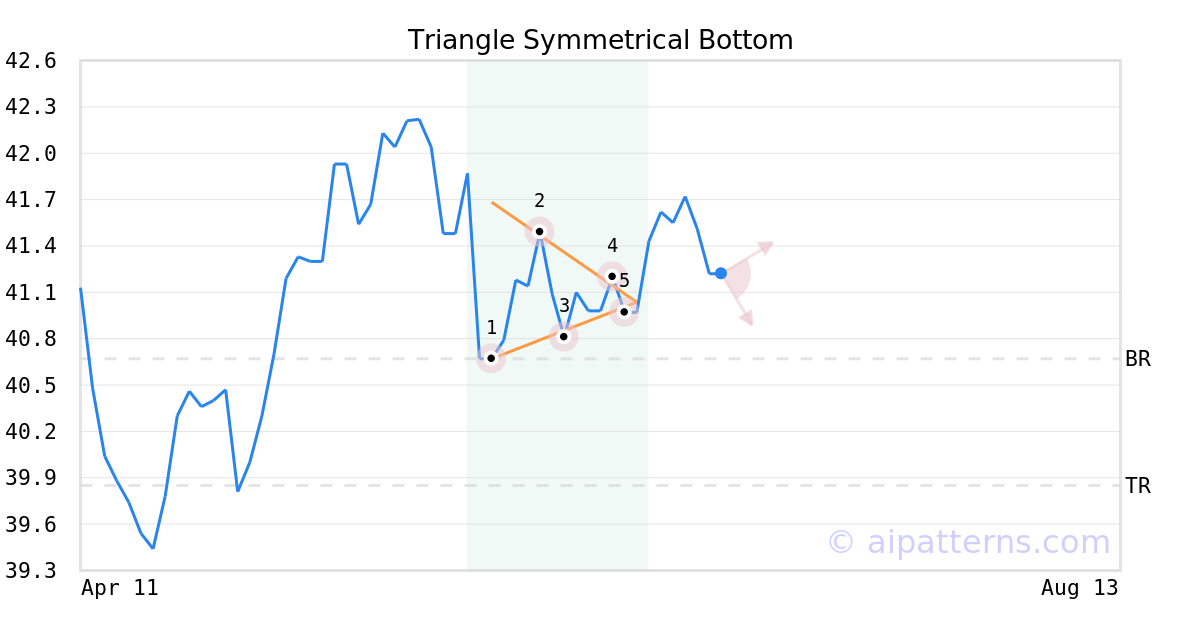
Emerged: 06/14/24
Breakout: $40.67
Price: $41.51
Target price: $39.85
A.I.dvisor detected a bearish Triangle Symmetrical Bottom pattern for PCBIX stock. This pattern was detected on June 14, 2024 . The odds of reaching the target price are 6.
The Symmetrical Triangle Bottom pattern forms when the price of a security fails to retest a high or a low and ultimately forms two narrowing trend lines. Points (1, 5) form the triangle patterns.
Consider selling the security short or buying a put option at the downward breakout price level. When trading, wait for the confirmation move, which is when the price falls below the breakout level.
View a ticker or compare two or three
VS
VS
Interact to see
Advertisement
Advertisement
A.I.Advisor
published price charts
These past five trading days, the mutual fund lost 0.00%.
A.I. Advisor
published General Information
General Information
Category MidCapGrowth
Profile
Fundamentals
Details
Category
Mid-Cap Growth
Address
Principal Financial Group711 High StreetDes Moines
Phone
(800) 986-3343
Web
www.principalfunds.com