PCQ Stock Tickeron detected bearish ETF Pattern: Broadening Wedge Ascending PCQ on November 13, 2025, netting in a 0.72% gain over 6 days


at Tickeron.com


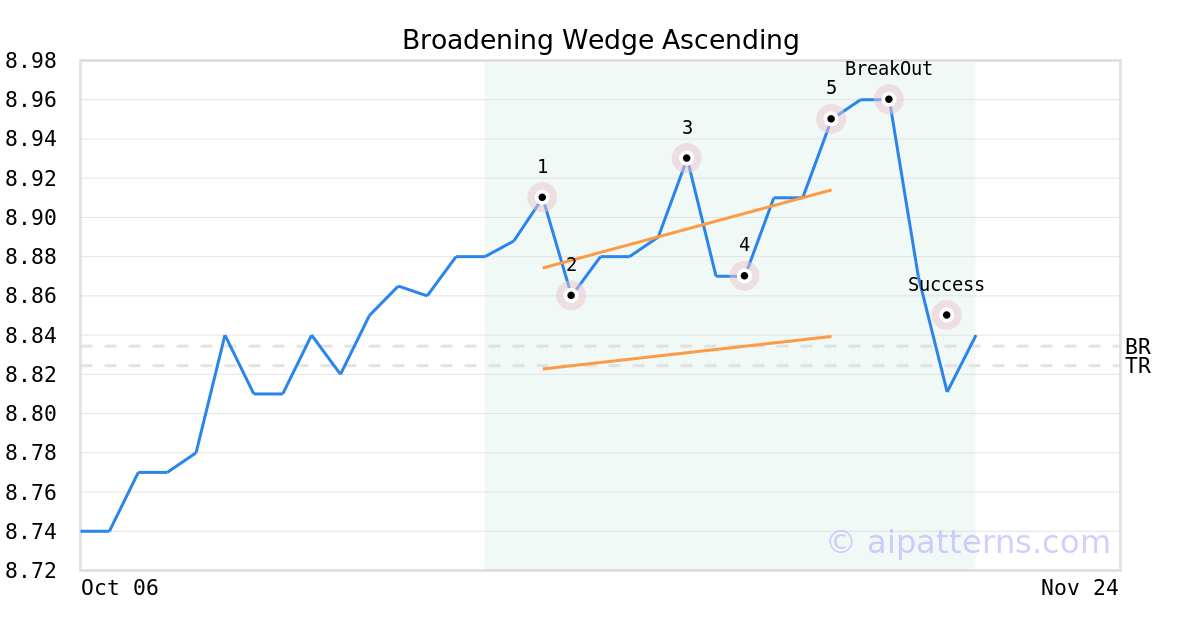
On November 11, 2025, A.I.dvisor detected a Broadening Wedge Ascending Pattern (Bearish) for Pimco California Municipal Income Fund (PCQ, $8.91). 2 days later, on November 13, 2025, A.I.dvisor confirmed the Bearish pattern, setting a target price of the stock. On November 17, 2025, the stock hit the target price of $8.82 – resulting in a gain for traders who shorted the stock on the pattern detection date.
PCQ in -0.79% downward trend, declining for three consecutive days on November 18, 2025
Moving lower for three straight days is viewed as a bearish sign. Keep an eye on this stock for future declines. Considering data from situations where PCQ declined for three days, in of 308 cases, the price declined further within the following month. The odds of a continued downward trend are .

Technical Analysis (Indicators)
Bearish Trend Analysis
The 10-day RSI Indicator for PCQ moved out of overbought territory on November 14, 2025. This could be a bearish sign for the stock. Traders may want to consider selling the stock or buying put options. Tickeron's A.I.dvisor looked at 33 similar instances where the indicator moved out of overbought territory. In of the 33 cases, the stock moved lower in the following days. This puts the odds of a move lower at .
The Momentum Indicator moved below the 0 level on November 17, 2025. You may want to consider selling the stock, shorting the stock, or exploring put options on PCQ as a result. In of 91 cases where the Momentum Indicator fell below 0, the stock fell further within the subsequent month. The odds of a continued downward trend are .
PCQ broke above its upper Bollinger Band on November 11, 2025. This could be a sign that the stock is set to drop as the stock moves back below the upper band and toward the middle band. You may want to consider selling the stock or exploring put options.
Bullish Trend Analysis
The Stochastic Oscillator is in the oversold zone. Keep an eye out for a move up in the foreseeable future.
Following a 3-day Advance, the price is estimated to grow further. Considering data from situations where PCQ advanced for three days, in of 283 cases, the price rose further within the following month. The odds of a continued upward trend are .
The Aroon Indicator entered an Uptrend today. In of 183 cases where PCQ Aroon's Indicator entered an Uptrend, the price rose further within the following month. The odds of a continued Uptrend are .
Advertisement
General Information
Category Unknown