PFO Stock Tickeron detected bearish ETF Pattern: Broadening Bottom on November 04, 2025


at Tickeron.com


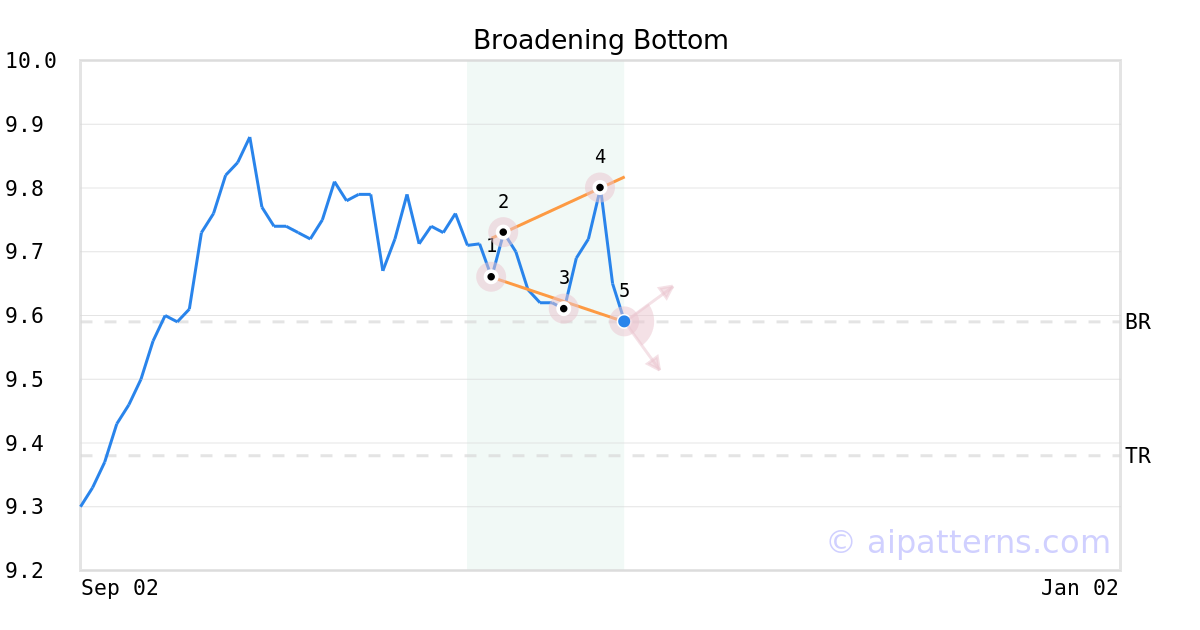
A.I.dvisor detected a bearish Broadening Bottom pattern for PFO stock. This pattern was detected on November 04, 2025 . The odds of reaching the target price are 6.
The Broadening Bottom pattern forms when a security price makes higher highs (2, 4) and lower lows (1, 3, 5) following two widening trend lines.
Consider selling the security short or buying a put option at the downward breakout price level. When trading, wait for the confirmation move, which is when the price falls below the breakout level.
PFO sees MACD Histogram just turned negative
PFO saw its Moving Average Convergence Divergence Histogram (MACD) turn negative on November 03, 2025. This is a bearish signal that suggests the stock could decline going forward. Tickeron's A.I.dvisor looked at 50 instances where the indicator turned negative. In of the 50 cases the stock moved lower in the days that followed. This puts the odds of a downward move at .

Technical Analysis (Indicators)
Bearish Trend Analysis
The Momentum Indicator moved below the 0 level on November 13, 2025. You may want to consider selling the stock, shorting the stock, or exploring put options on PFO as a result. In of 76 cases where the Momentum Indicator fell below 0, the stock fell further within the subsequent month. The odds of a continued downward trend are .
PFO moved below its 50-day moving average on November 13, 2025 date and that indicates a change from an upward trend to a downward trend.
The 10-day moving average for PFO crossed bearishly below the 50-day moving average on November 14, 2025. This indicates that the trend has shifted lower and could be considered a sell signal. In of 12 past instances when the 10-day crossed below the 50-day, the stock continued to move higher over the following month. The odds of a continued downward trend are .
Following a 3-day decline, the stock is projected to fall further. Considering past instances where PFO declined for three days, the price rose further in of 62 cases within the following month. The odds of a continued downward trend are .
PFO broke above its upper Bollinger Band on October 31, 2025. This could be a sign that the stock is set to drop as the stock moves back below the upper band and toward the middle band. You may want to consider selling the stock or exploring put options.
Bullish Trend Analysis
The Stochastic Oscillator demonstrated that the ticker has stayed in the oversold zone for 1 day, which means it's wise to expect a price bounce in the near future.
Following a 3-day Advance, the price is estimated to grow further. Considering data from situations where PFO advanced for three days, in of 315 cases, the price rose further within the following month. The odds of a continued upward trend are .
The Aroon Indicator entered an Uptrend today. In of 220 cases where PFO Aroon's Indicator entered an Uptrend, the price rose further within the following month. The odds of a continued Uptrend are .
Advertisement
General Information
Category Unknown