PIFI Stock Tickeron detected bullish ETF Pattern: Triple Bottoms on February 05, 2024


at Tickeron.com


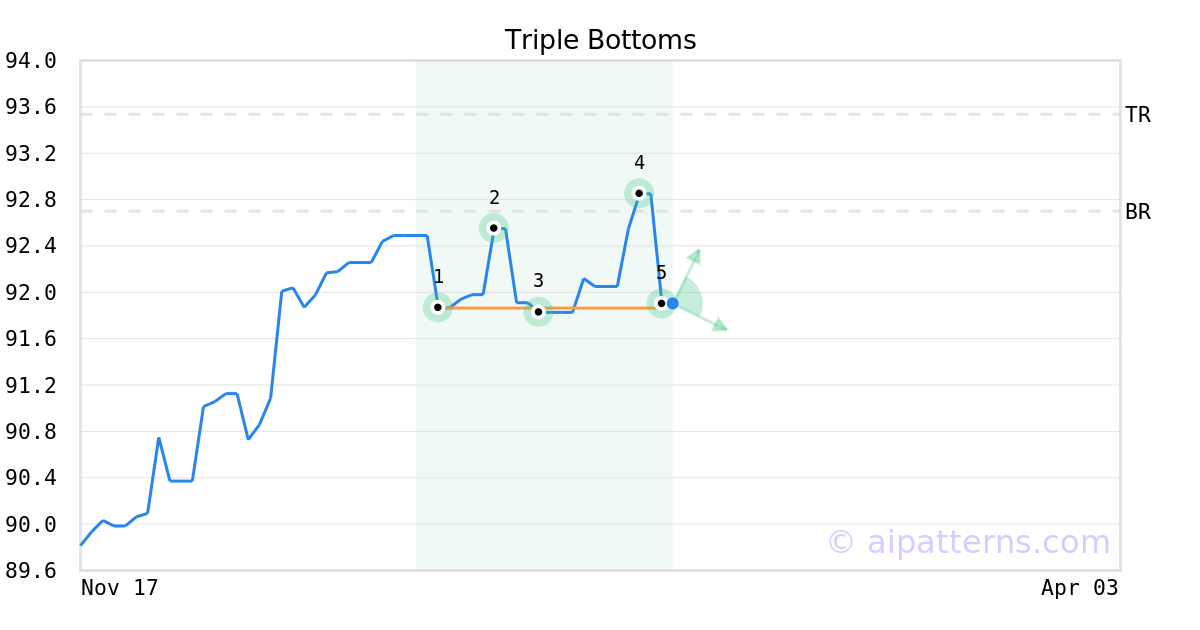
A.I.dvisor detected a bullish Triple Bottoms pattern for PIFI stock. This pattern was detected on February 05, 2024 . The odds of reaching the target price are 7.
The Triple Bottom pattern appears when there are three distinct low points (1, 3, 5) that represent a consistent support level.
Consider buying a security or call option at the breakout price level. When trading, wait for the confirmation move, which is when the price rises above the breakout level.
Momentum Indicator for PIFI turns positive, indicating new upward trend
PIFI saw its Momentum Indicator move above the 0 level on November 12, 2025. This is an indication that the stock could be shifting in to a new upward move. Traders may want to consider buying the stock or buying call options. Tickeron's A.I.dvisor looked at 79 similar instances where the indicator turned positive. In of the 79 cases, the stock moved higher in the following days. The odds of a move higher are at .

Technical Analysis (Indicators)
Bullish Trend Analysis
The Moving Average Convergence Divergence (MACD) for PIFI just turned positive on November 21, 2025. Looking at past instances where PIFI's MACD turned positive, the stock continued to rise in of 48 cases over the following month. The odds of a continued upward trend are .
Following a 3-day Advance, the price is estimated to grow further. Considering data from situations where PIFI advanced for three days, in of 257 cases, the price rose further within the following month. The odds of a continued upward trend are .
The Aroon Indicator entered an Uptrend today. In of 237 cases where PIFI Aroon's Indicator entered an Uptrend, the price rose further within the following month. The odds of a continued Uptrend are .
Bearish Trend Analysis
The RSI Indicator demonstrates that the ticker has stayed in the overbought zone for 4 days. The longer the ticker stays in the overbought zone, the sooner a price pull-back is expected.
The Stochastic Oscillator demonstrated that the ticker has stayed in the overbought zone for 5 days. The longer the ticker stays in the overbought zone, the sooner a price pull-back is expected.
PIFI broke above its upper Bollinger Band on November 21, 2025. This could be a sign that the stock is set to drop as the stock moves back below the upper band and toward the middle band. You may want to consider selling the stock or exploring put options.
Advertisement
General Information
Category IntermediateTermBond