PML Stock Tickeron detected bearish ETF Pattern: Cup-and-Handle Inverse on October 20, 2025


at Tickeron.com


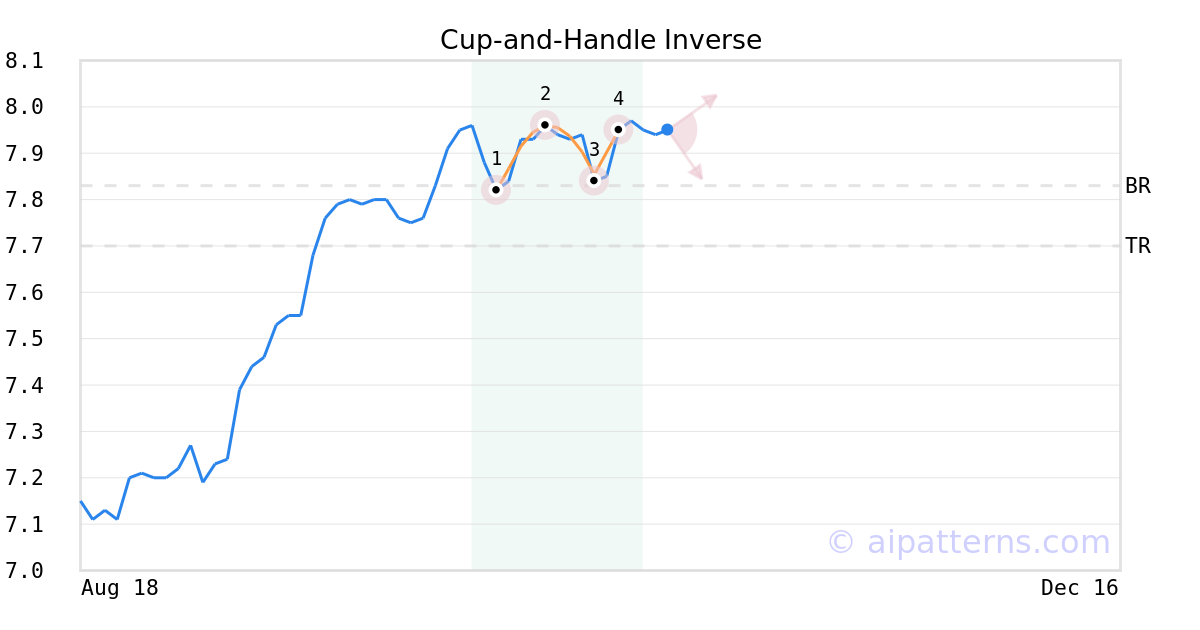
A.I.dvisor detected a bearish Cup-and-Handle Inverse pattern for PML stock. This pattern was detected on October 20, 2025 . The odds of reaching the target price are 6.
The Inverted Cup-and-Handle (sometimes called Inverted Cup-and-Holder) pattern forms when prices rise then decline to create an upside-down “U”like shape (1, 2, 3, also known as the Cup), followed by a shorter relatively straight price increase that bounces from the right lip (from 3 to 4, creating the Handle).
Consider selling the security short or buying a put option at the downward breakout level. The confirmation move is the breakout of the price below the right cup lip.
PML in -0.76% downward trend, declining for three consecutive days on November 18, 2025
Moving lower for three straight days is viewed as a bearish sign. Keep an eye on this stock for future declines. Considering data from situations where PML declined for three days, in of 289 cases, the price declined further within the following month. The odds of a continued downward trend are .

Technical Analysis (Indicators)
Bearish Trend Analysis
The 10-day RSI Indicator for PML moved out of overbought territory on October 16, 2025. This could be a bearish sign for the stock. Traders may want to consider selling the stock or buying put options. Tickeron's A.I.dvisor looked at 26 similar instances where the indicator moved out of overbought territory. In of the 26 cases, the stock moved lower in the following days. This puts the odds of a move lower at .
The Momentum Indicator moved below the 0 level on November 14, 2025. You may want to consider selling the stock, shorting the stock, or exploring put options on PML as a result. In of 69 cases where the Momentum Indicator fell below 0, the stock fell further within the subsequent month. The odds of a continued downward trend are .
Bullish Trend Analysis
The Stochastic Oscillator suggests the stock price trend may be in a reversal from a downward trend to an upward trend. of 54 cases where PML's Stochastic Oscillator exited the oversold zone resulted in an increase in price. Tickeron's analysis proposes that the odds of a continued upward trend are .
The 50-day moving average for PML moved above the 200-day moving average on October 22, 2025. This could be a long-term bullish signal for the stock as the stock shifts to an upward trend.
Following a 3-day Advance, the price is estimated to grow further. Considering data from situations where PML advanced for three days, in of 275 cases, the price rose further within the following month. The odds of a continued upward trend are .
The Aroon Indicator entered an Uptrend today. In of 208 cases where PML Aroon's Indicator entered an Uptrend, the price rose further within the following month. The odds of a continued Uptrend are .
Advertisement
General Information
Category Unknown