PPC Stock Tickeron detected bullish Stock Pattern: Cup-and-Handle on November 14, 2025


at Tickeron.com


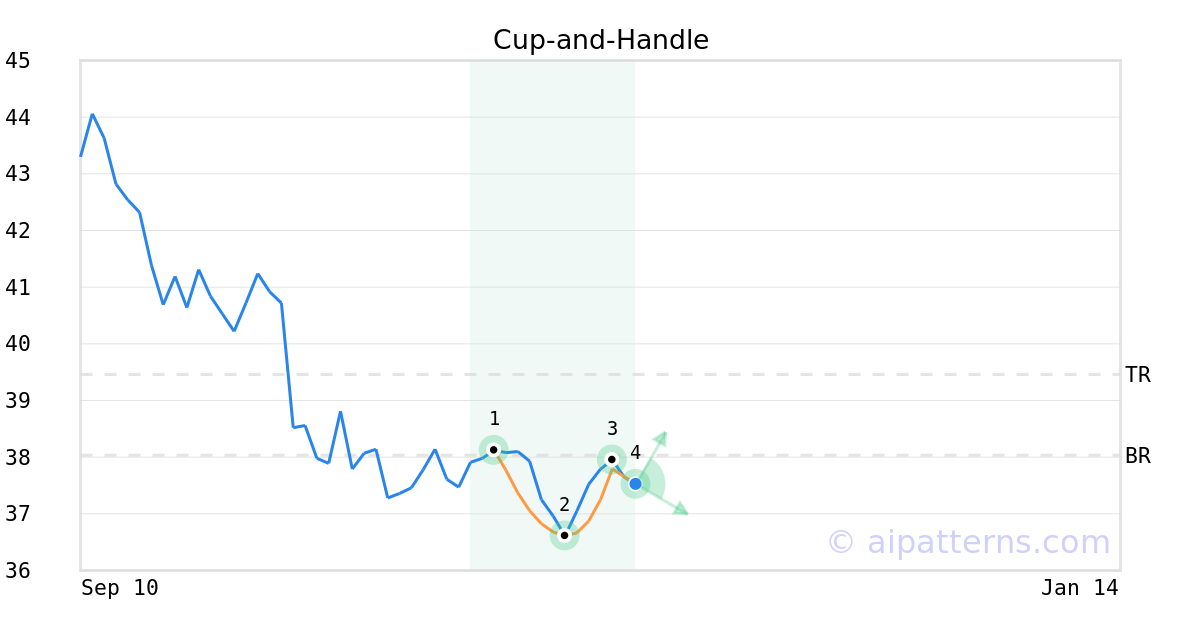
A.I.dvisor detected a bullish Cup-and-Handle pattern for PPC stock. This pattern was detected on November 14, 2025 . The odds of reaching the target price are 6.
The Cup-and-Handle (sometimes called Cup-and-Holder) pattern is formed when the price of a security initially declines and then rises to form a “U”-like rounded shape (1, 2, 3, also known as the Cup). Once it forms the right lip, it is characterized by short, relatively straight price decline (from 3 to 4) forming the handle.
Consider buying a security or call option at the upward breakout price/entry point. The confirmation move is when the security moves past the breakout price above the right cup lip.
Aroon Indicator for PPC shows an upward move is likely
PPC's Aroon Indicator triggered a bullish signal on December 02, 2025. Tickeron's A.I.dvisor detected that the AroonUp green line is above 70 while the AroonDown red line is below 30. When the up indicator moves above 70 and the down indicator remains below 30, it is a sign that the stock could be setting up for a bullish move. Traders may want to buy the stock or look to buy calls options. A.I.dvisor looked at 258 similar instances where the Aroon Indicator showed a similar pattern. In of the 258 cases, the stock moved higher in the days that followed. This puts the odds of a move higher at .

Technical Analysis (Indicators)
Bullish Trend Analysis
The RSI Oscillator points to a transition from a downward trend to an upward trend -- in cases where PPC's RSI Oscillator exited the oversold zone, of 26 resulted in an increase in price. Tickeron's analysis proposes that the odds of a continued upward trend are .
The Momentum Indicator moved above the 0 level on November 28, 2025. You may want to consider a long position or call options on PPC as a result. In of 72 past instances where the momentum indicator moved above 0, the stock continued to climb. The odds of a continued upward trend are .
PPC moved above its 50-day moving average on December 01, 2025 date and that indicates a change from a downward trend to an upward trend.
Following a 3-day Advance, the price is estimated to grow further. Considering data from situations where PPC advanced for three days, in of 326 cases, the price rose further within the following month. The odds of a continued upward trend are .
Bearish Trend Analysis
The Stochastic Oscillator entered the overbought zone. Expect a price pull-back in the foreseeable future.
Following a 3-day decline, the stock is projected to fall further. Considering past instances where PPC declined for three days, the price rose further in of 62 cases within the following month. The odds of a continued downward trend are .
PPC broke above its upper Bollinger Band on December 01, 2025. This could be a sign that the stock is set to drop as the stock moves back below the upper band and toward the middle band. You may want to consider selling the stock or exploring put options.
Fundamental Analysis (Ratings)
The Tickeron SMR rating for this company is (best 1 - 100 worst), indicating very strong sales and a profitable business model. SMR (Sales, Margin, Return on Equity) rating is based on comparative analysis of weighted Sales, Income Margin and Return on Equity values compared against S&P 500 index constituents. The weighted SMR value is a proprietary formula developed by Tickeron and represents an overall profitability measure for a stock.
The Tickeron Profit vs. Risk Rating rating for this company is (best 1 - 100 worst), indicating low risk on high returns. The average Profit vs. Risk Rating rating for the industry is 84, placing this stock better than average.
The Tickeron Price Growth Rating for this company is (best 1 - 100 worst), indicating fairly steady price growth. PPC’s price grows at a lower rate over the last 12 months as compared to S&P 500 index constituents.
The Tickeron Valuation Rating of (best 1 - 100 worst) indicates that the company is slightly overvalued in the industry. This rating compares market capitalization estimated by our proprietary formula with the current market capitalization. This rating is based on the following metrics, as compared to industry averages: P/B Ratio (2.609) is normal, around the industry mean (36.973). P/E Ratio (7.539) is within average values for comparable stocks, (84.152). Projected Growth (PEG Ratio) (0.615) is also within normal values, averaging (2.841). PPC has a moderately low Dividend Yield (0.000) as compared to the industry average of (0.038). P/S Ratio (0.505) is also within normal values, averaging (137.232).
The Tickeron PE Growth Rating for this company is (best 1 - 100 worst), pointing to worse than average earnings growth. The PE Growth rating is based on a comparative analysis of stock PE ratio increase over the last 12 months compared against S&P 500 index constituents.
Advertisement
General Information
a company which engages in production, processing, marketing, and distribution of fresh, frozen and value-added chicken products
Industry FoodMajorDiversified